高效地将点与几何图形(点在多边形内)进行匹配,用于大量的点和多边形集合。

7
这里有很多关于如何高效地在多边形中匹配点的问题(例如:这里这里)。这些问题涉及到的主要变量是大量点N和多边形顶点数V。 这些都是很好很有用的,但我想处理点数N很多且多边形G很多的情况。这也意味着我的输出将不同(我主要看到的输出由落入多边形内的点组成,但我想知道与一个点相关联的多边形)。
我有一个包含大量多边形(数十万个)的shapefile文件。多边形可以相接,但它们之间几乎没有重叠(任何内部重叠都是错误的结果 - 比如人口普查区块组)。 我还有一个包含数百万个点的csv文件,并且如果可能的话,我想根据点位于哪个多边形中对这些点进行分类。有些点可能不属于多边形(继续上面的例子,考虑在海洋上方的点)。下面我设置了一个玩具示例来研究这个问题。
设置:
import numpy as np
from shapely.geometry import shape, MultiPolygon, Point, Polygon
import geopandas as gpd
import pandas as pd
import matplotlib.pyplot as plt
from shapely.strtree import STRtree

#setup:
np.random.seed(12345)

# shape gridsize:
gridsize=10
avgpointspergridspace=10 #point density

创建多边形的地理数据框(模拟使用geopandas导入的shapefile):
# creating a geodataframe (shapefile imported via geopandas):
garr=np.empty((gridsize,gridsize),dtype=object)
for i in range(gridsize):
    for j in range(gridsize):
        garr[i,j]=Point(i,j)

# polygons:
poly_list=[]
for i in range(gridsize-1):
    for j in range(gridsize-1):
        temp_points=[garr[i,j],garr[i,j+1],garr[i+1,j+1],garr[i+1,j],garr[i,j]]
        poly=Polygon([[p.x,p.y] for p in temp_points])
        poly_list+=[poly]

# creating a geodataframe, including some additional numeric and string variables:
gdf=gpd.GeoDataFrame()
gdf['geometry']= poly_list
gdf['id']=list(range(len(gdf['geometry'])))
gdf['numeric']=0
gdf['string']='foo'

# creating some holes in the grid:
gdf['included']=[np.random.choice([True,False],p=[.95,.05]) for x in range(len(gdf))]
gdf_polys=gdf[gdf['included']]

生成点(模拟通过pandas导入的csv):

# creating a pandas dataframe with points (csv of coordinates imported to pandas):
npoints=(gridsize+2)**2*10
fgridend=gridsize+1
fgridstart=-1

xlist=[]
ylist=[]
points=[]
for i in range(npoints):
    x=fgridstart+np.random.random()*fgridend
    y=fgridstart+np.random.random()*fgridend
    xlist+=[x]
    ylist+=[y]

df=pd.DataFrame(list(zip(xlist,ylist)),columns=['x','y'])

coords=[Point(xy) for xy in zip(df['x'],df['y'])]

gdf_points=gpd.GeoDataFrame(df,geometry=coords)
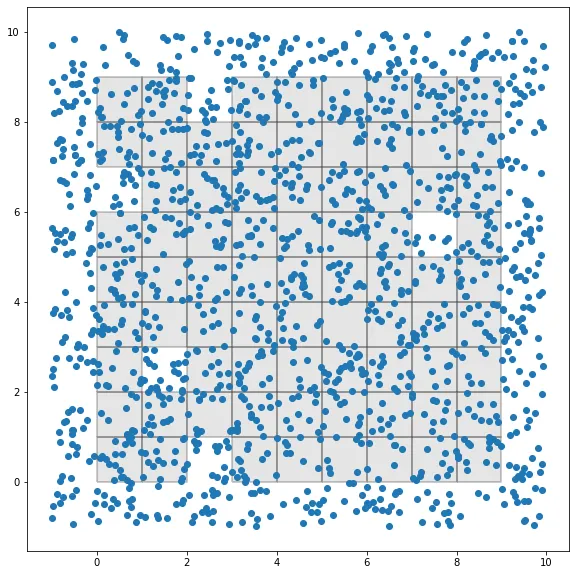
绘制结果:

fig, ax = plt.subplots(figsize=[10,10])
gdf_polys.plot(ax=ax,facecolor='gray',alpha=.2,edgecolor='black',lw=2)
gdf_points.plot(ax=ax)

返回:

返回:

点和多边形的图

现在我想把点和多边形进行匹配。所以期望的输出是在gdf_points中增加一个附加列,该列包含一个标识符,表示该点与哪个多边形相关联(使用 gdf_polys ['id'] 列)。我的代码速度非常慢,但可以得出正确结果,如下所示:

def id_gen(row):
    point=row['geometry']
    out=0
    for i,poly in shapes_list:
        if poly.contains(point):
            out=i
            break
    return out
        
#shapes_list=gdf_polys['geometry']
shapes_list=[(gdf_polys['id'].iloc[i],gdf_polys['geometry'].iloc[i]) for i in range(len(gdf_polys['geometry']))]
point_list=[]
gdf_points['poly']=gdf_points.apply(id_gen,axis=1)

返回:

    x   y   geometry    poly
0   4.865555    1.777419    POINT (4.86555 1.77742) 37
1   6.929483    3.041826    POINT (6.92948 3.04183) 57
2   4.485133    1.492326    POINT (4.48513 1.49233) 37
3   2.889222    6.159370    POINT (2.88922 6.15937) 24
4   2.442262    7.456090    POINT (2.44226 7.45609) 25
... ... ... ... ...
1435    6.414556    5.254309    POINT (6.41456 5.25431) 59
1436    6.409027    4.454615    POINT (6.40903 4.45461) 58
1437    5.763154    2.770337    POINT (5.76315 2.77034) 47
1438    9.613874    1.371165    POINT (9.61387 1.37116) 0
1439    6.013953    3.622011    POINT (6.01395 3.62201) 57
1440 rows × 4 columns

需要注意的是,实际的shapefile形状比这个网格复杂得多。我认为有几个地方可以加速:

  1. 不需要遍历每一个多边形(随着P的增加,这将变得笨重)
  2. 使用不同的点-多边形算法。我感觉应该有一种方法可以使用STRtree来实现这个,但目前我只能够返回点而不是索引。
  3. 向量化数据框操作(避免使用apply函数)
  4. 可能还有其他未被我考虑到的东西(并行化或其他)

开始基准测试: 网格大小为10,点密度为10(共1440个点):大约需要180毫秒 网格大小为20,点密度为10(共4840个点):大约需要2.8秒 网格大小为30,点密度为10(共10240个点):大约需要12.8秒 网格大小为50,点密度为10(共27040个点):大约需要1.5分钟 因此我们可以看到这样的规模扩展性很差。

3个回答

3
与其将其视为点在多边形中的质心,geopandas有一个空间连接方法,在这里非常有用。它实际上相当快速,并且至少在这个玩具示例中,不会受到多边形数量的影响(虽然我不能排除这可能是由于这些多边形的简单性造成的)。 空间连接接受两个地理数据框并将它们合并在一起。在这种情况下,我希望将多边形的属性附加到位于其中的点。因此,我的代码如下所示:
joined=gpd.sjoin(gdf_points,gdf_polys,how='left',op='within')

返回:

    x   y   geometry    poly    index_right id  numeric string  included
0   18.651358   26.920261   POINT (18.65136 26.92026)   908 908.0   908.0   0.0 foo True
1   38.577101   1.505424    POINT (38.57710 1.50542)    1863    1863.0  1863.0  0.0 foo True
2   15.430436   15.543219   POINT (15.43044 15.54322)   750 750.0   750.0   0.0 foo True
3   44.928141   7.726345    POINT (44.92814 7.72635)    2163    2163.0  2163.0  0.0 foo True
4   34.259632   5.373809    POINT (34.25963 5.37381)    1671    1671.0  1671.0  0.0 foo True
... ... ... ... ... ... ... ... ... ...
27035   32.386086   23.440186   POINT (32.38609 23.44019)   1591    1591.0  1591.0  0.0 foo True
27036   7.569414    1.836633    POINT (7.56941 1.83663) 344 344.0   344.0   0.0 foo True
27037   1.141440    34.739388   POINT (1.14144 34.73939)    83  83.0    83.0    0.0 foo True
27038   -0.770784   14.027607   POINT (-0.77078 14.02761)   0   NaN NaN NaN NaN NaN
27039   12.695803   33.405048   POINT (12.69580 33.40505)   621 621.0   621.0   0.0 foo True

与我最初的代码相比,这个速度非常快。运行我测试的最大尺寸(27k点)只需要不到60毫秒(而之前的代码需要1.5分钟)。扩展到我的实际工作中,100万个点只需要13秒多一点的时间就能匹配到将近20万个多边形,其中大部分比我玩具示例中使用的几何体更加复杂。这似乎是一种可行的方法,但我很想了解如何进一步提高效率的方法。

1
看起来您可以使用最近的STRtree算法来避免遍历所有多边形,如文档中所述(以及关于恢复多边形索引的注意事项)- 并检查点是否位于最近的多边形内。也就是说,类似于以下内容:
from shapely.strtree import STRtree
#... coords is the list of shapely points and poly_list is the list of polygons ...
#to recover the polygon id, use their unique python id.
poly_id = dict((id(poly), i) for i, poly in enumerate(poly_list))
#form stretree of polygons
poly_tree = STRtree(poly_list)
pt_to_id = []
#fill pt_to_id with the nearest polygon if it contains the given point. If the point is within no polygon write None.
for c in coords:
    near = poly_tree.nearest(c)
    if near.contains(c):
        pt_to_id.append(poly_id[id(near)])
    else:
        pt_to_id.append(None) 

0

借鉴其他答案以及其他主题上的灵感,对于非常大的点集(数十亿)和可能跨越大范围的多边形,对我来说效果最好的解决方案是将数据分成几个部分,并结合 geopandas.sjoin 和从 osmnx 库借用的切片实现。

思路是将每个多边形切割成规则形状,使得 sjoin 可以通过边界框更高效地进行查找。

import math
import numpy as np
from shapely.geometry import MultiPolygon, LineString
from shapely.ops import split
import geopandas as gp

def quadrat_cut_geometry(geometry, quadrat_width, min_num=1):
    """
    Split a Polygon or MultiPolygon up into sub-polygons of a specified size.
    Parameters
    ----------
    geometry : shapely.geometry.Polygon or shapely.geometry.MultiPolygon
        the geometry to split up into smaller sub-polygons
    quadrat_width : numeric
        the linear width of the quadrats with which to cut up the geometry (in
        the units the geometry is in)
    min_num : int
        the minimum number of linear quadrat lines (e.g., min_num=3 would
        produce a quadrat grid of 4 squares)
    Returns
    -------
    geometry : shapely.geometry.MultiPolygon
    """
    # create n evenly spaced points between the min and max x and y bounds
    west, south, east, north = geometry.bounds
    x_num = math.ceil((east - west) / quadrat_width) + 1
    y_num = math.ceil((north - south) / quadrat_width) + 1
    x_points = np.linspace(west, east, num=max(x_num, min_num))
    y_points = np.linspace(south, north, num=max(y_num, min_num))

    # create a quadrat grid of lines at each of the evenly spaced points
    vertical_lines = [LineString([(x, y_points[0]), (x, y_points[-1])]) for x in x_points]
    horizont_lines = [LineString([(x_points[0], y), (x_points[-1], y)]) for y in y_points]
    lines = vertical_lines + horizont_lines

    # recursively split the geometry by each quadrat line
    for line in lines:
        geometry = MultiPolygon(split(geometry, line))

    return geometry


def assign_region(points, polygons, region_name):
    """
    Assigns region definitions to a GeoDataFrame of points.
    Parameters
    ----------
    points : geopandas.GeoDataFrame
        Input data that contains a geometry field with the point locations
    polygons : geopandas.GeoDataFrame
        Polygon data for each region to be matched
    region_name : str
        Name of the column in the polygons GeoDataFrame that contains the 
        region name which will be assigned to the points data
    Returns
    -------
    geopandas.GeoDataFrame
    """
    cut_polygons = []
    for region, poly in polygons.set_index(region_name)['geometry'].iteritems():
        cut_geom = quadrat_cut_geometry(poly, 0.1)
        cut_geom = [{region_name: region, 'geometry': geom.buffer(1e-14).buffer(0)} for geom in cut_geom]
        cut_polygons.extend(cut_geom)
    cut_polygons = gp.GeoDataFrame(cut_polygons)
    merged = gp.sjoin(points, cut_polygons, how='inner', op='within')
    return merged

使用时,只需将包含多边形的GeoDataFrame和包含点的另一个GeoDataFrame传递给assign_region函数。这将返回带有来自多边形DataFrame的标识符列的点DataFrame。

网页内容由stack overflow 提供, 点击上面的
可以查看英文原文,
原文链接