我有一个包含美国所有县的shapefile,并且我正在对一些经纬度进行查询,然后找出这些点所在的县。目前我只是循环遍历所有县并执行pnt.within(county)。这不太高效。有更好的方法吗?
1个回答
4
您的情况看起来是一个典型的需要使用“空间连接(spatial joins)”的案例。空间连接的思想是使用地理坐标而不是属性来合并数据。
在geopandas中有三种可能性: - intersects - within - contains
看起来您想要用"within",可以使用以下语法实现:
在geopandas中有三种可能性: - intersects - within - contains
看起来您想要用"within",可以使用以下语法实现:
geopandas.sjoin(points, polygons, how="inner", op='within')
注意:您需要安装rtree才能执行此类操作。如果需要安装依赖项,请使用pip或conda进行安装。
示例
作为一个示例,让我们绘制欧洲城市。这两个示例数据集是
import geopandas
import matplotlib.pyplot as plt

world = geopandas.read_file(geopandas.datasets.get_path('naturalearth_lowres'))
cities = geopandas.read_file(geopandas.datasets.get_path('naturalearth_cities'))
countries = world[world['continent'] == "Europe"].rename(columns={'name':'country'})

countries.head(2)
    pop_est     continent   country     iso_a3  gdp_md_est  geometry
18  142257519   Europe  Russia  RUS     3745000.0   MULTIPOLYGON (((178.725 71.099, 180.000 71.516...
21  5320045     Europe  Norway  -99     364700.0    MULTIPOLYGON (((15.143 79.674, 15.523 80.016, ...

cities.head(2)
    name    geometry
0   Vatican City    POINT (12.45339 41.90328)
1   San Marino  POINT (12.44177 43.93610)
cities 是一个全球数据集,countries 是一个欧洲范围的数据集。
这两个数据集需要在相同的投影系统下。如果不是,请在合并之前使用 .to_crs 进行转换。
data_merged = geopandas.sjoin(cities, countries, how="inner", op='within')
最后,为了查看结果,让我们进行一次映射
f, ax = plt.subplots(1, figsize=(20,10))
data_merged.plot(axes=ax)
countries.plot(axes=ax, alpha=0.25, linewidth=0.1)
plt.show()
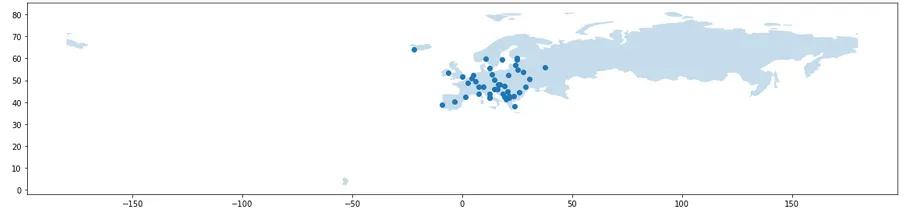
底层数据集合并了我们所需的信息。
data_merged.head(5)

    name    geometry    index_right     pop_est     continent   country     iso_a3  gdp_md_est
0   Vatican City    POINT (12.45339 41.90328)   141     62137802    Europe  Italy   ITA     2221000.0
1   San Marino  POINT (12.44177 43.93610)   141     62137802    Europe  Italy   ITA     2221000.0
192     Rome    POINT (12.48131 41.89790)   141     62137802    Europe  Italy   ITA     2221000.0
2   Vaduz   POINT (9.51667 47.13372)    114     8754413     Europe  Austria     AUT     416600.0
184     Vienna  POINT (16.36469 48.20196)   114     8754413     Europe  Austria     AUT     416600.0
在这里,我使用了inner连接方法,但是如果你想保留所有点(包括那些不在多边形内的点),你可以更改该参数。
- linog
网页内容由stack overflow 提供, 点击上面的可以查看英文原文,
原文链接
原文链接