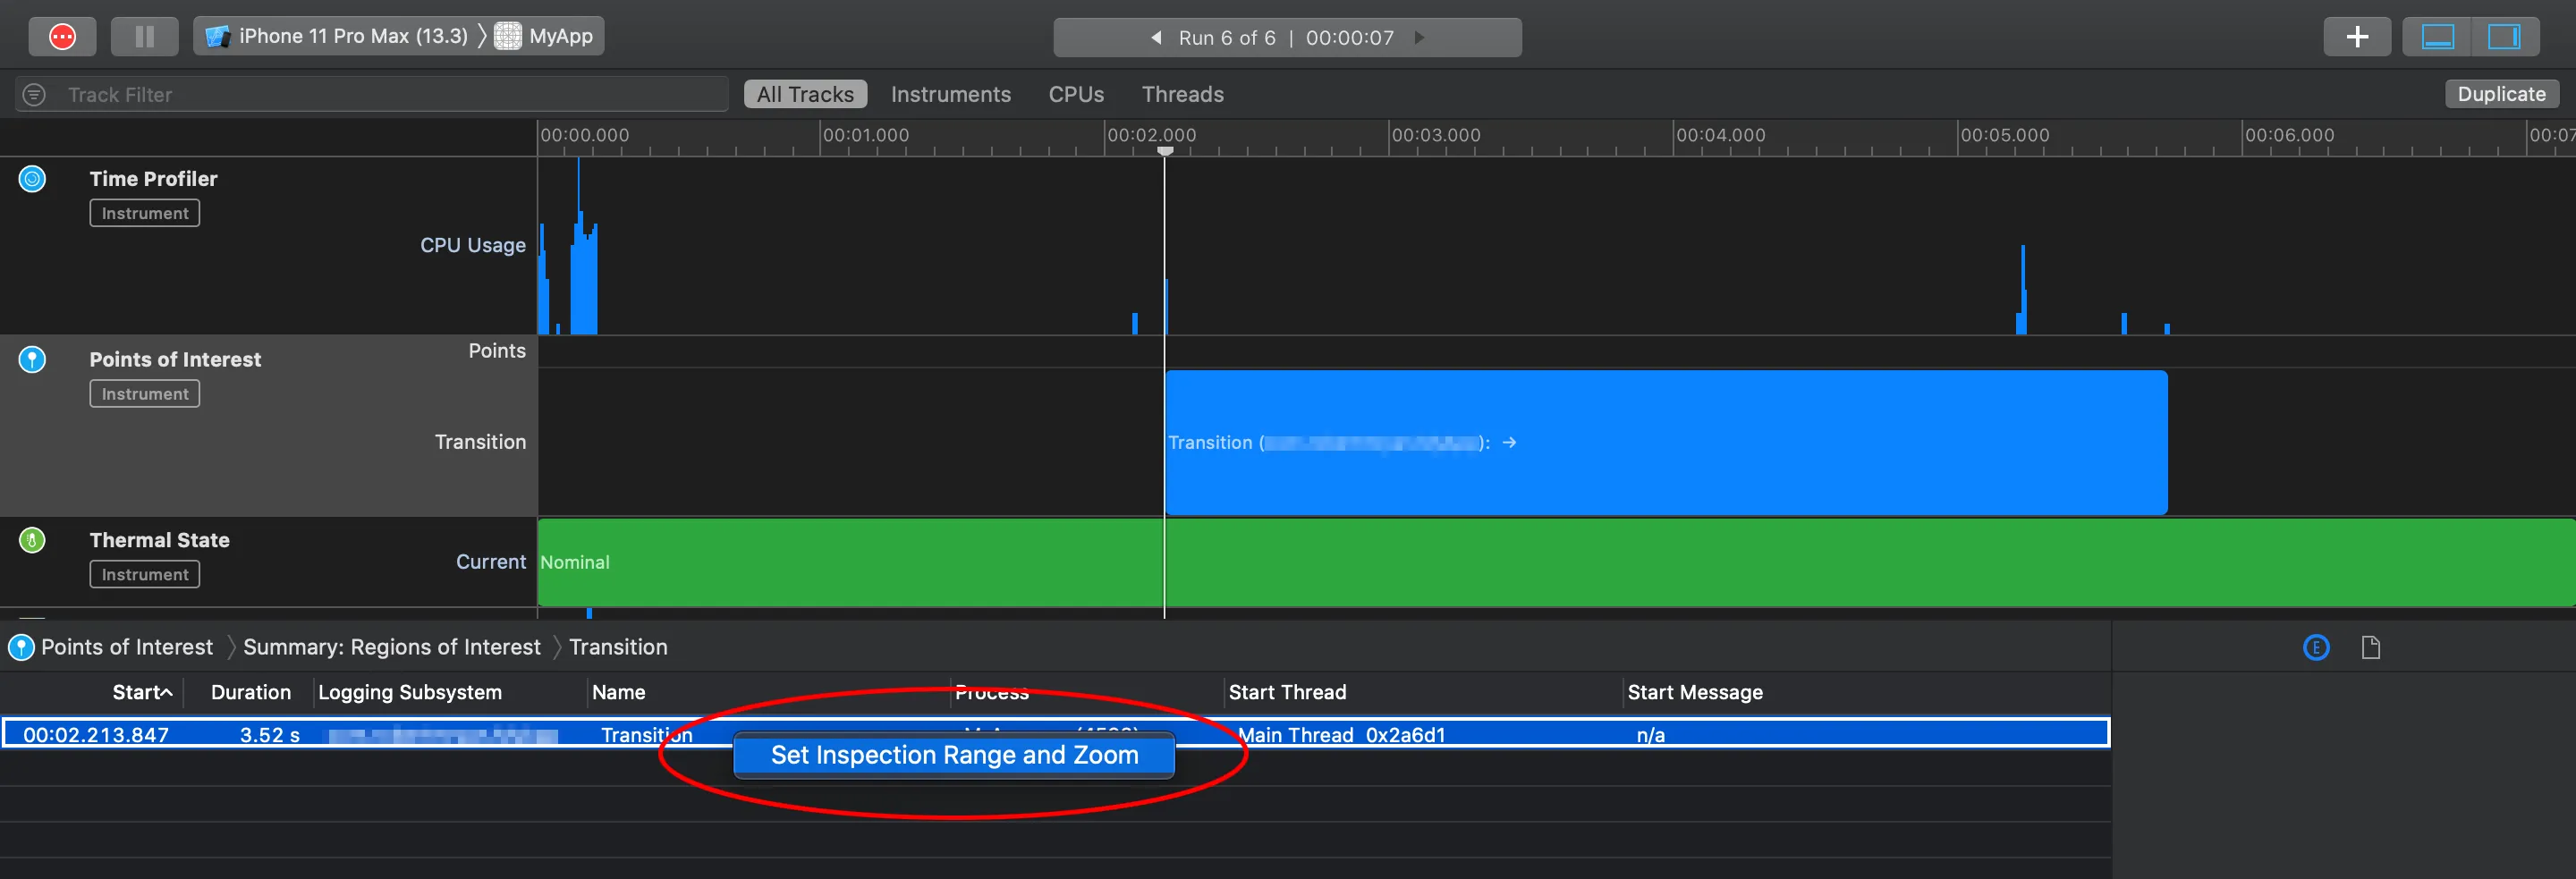
Yes, if you want to calculate the time elapsed between two points of code, signposts are a great way of doing that. And if you want to know what’s going on between those two signposts, a “points of interest” range, which you can zoom into by control-clicking. This lets you focus on the area in question:
I'd suggest selecting “Record Waiting Threads”. Sometimes your thread is blocked by something, and if you don’t choose this option, it won't capture samples when your thread is blocked, often making it harder to find the culprit.
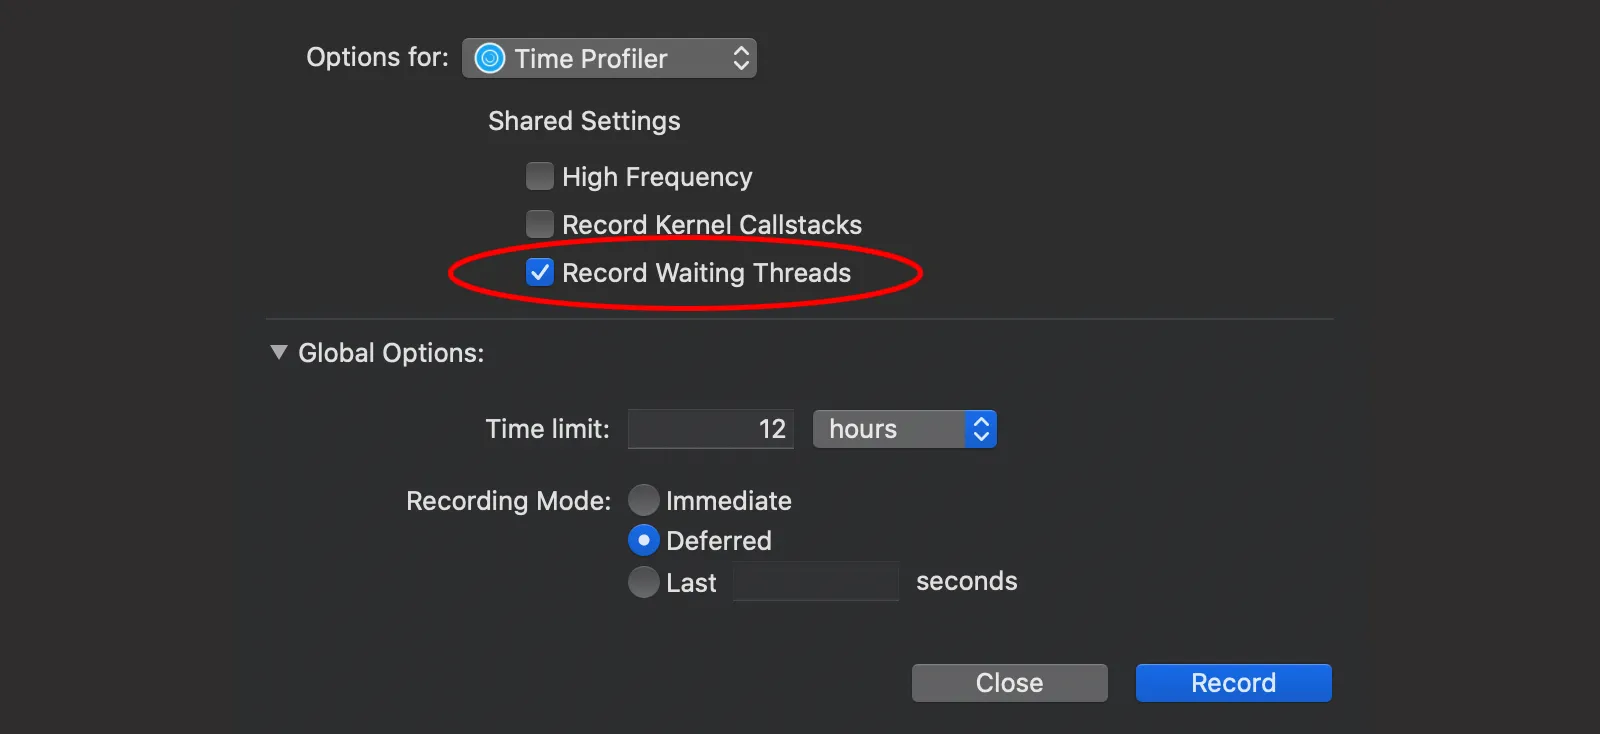
(I also tend to record in deferred mode, too, to minimize the observer effect.)
You said
you have to set your iOS version to 12 ...
Well, not quite. Sure, if you want to use os_signpost you have to do your profiling on an iOS 12 device/simulator, but you don’t have have to change the target of your app. You'd only have to wrap your logging statements in #available blocks, e.g.:
import UIKit
import os.log

@available(iOS 12.0, *)
let pointsOfInterest = OSLog(subsystem: Bundle.main.bundleIdentifier!, category: .pointsOfInterest)

class ViewController: UIViewController {
    @IBAction func didTapNextButton(_ sender: Any) {
        if #available(iOS 12.0, *) {
            os_signpost(.begin, log: pointsOfInterest, name: "Transition")
        }

        performSegue(withIdentifier: "Next", sender: self)
    }
}
and
import UIKit
import os.log

class SecondViewController: UIViewController {

    override func viewDidLoad() {
        super.viewDidLoad()

        somethingSlow()
    }

    override func viewDidAppear(_ animated: Bool) {
        super.viewDidAppear(animated)

        if #available(iOS 12.0, *) {
            os_signpost(.end, log: pointsOfInterest, name: "Transition")
        }
    }

    func somethingSlow() { ... }

}
If you don't like having that if #available check and you have to support older OS versions, just use kdebug:
kdebug_signpost_start(0, 0, 0, 0, 0)
and
kdebug_signpost_end(0, 0, 0, 0, 0)
You don't have nice names on your points of interest ranges, but it works in older iOS versions.
kdebug,你可能需要这样做。而使用OSLog,你需要在定义OSLog时加上.disabled的if逻辑,就像 https://gist.github.com/robertmryan/880d047aa0f8033924f2d7fafa06ad23 中的示例一样。顺便说一下,我不确定你是否想要使用#if DEBUG,因为你应该总是在优化构建上进行性能分析。在调试构建中对性能进行基准测试没有什么意义。 - Rob