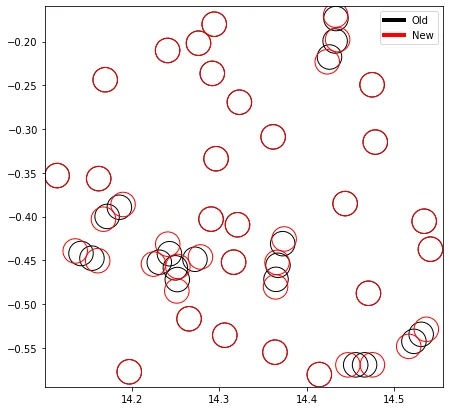
我正在尝试编写一段代码,针对给定的圆列表(list1),能够找到新圆的位置(list2)。list1和list2具有相同的长度,因为对于list1中的每个圆,都必须有一个来自list2的圆。
- 每对圆(假设是list1中的circle1和list2中的circle2)必须尽可能靠近,
- list2中的圆不能与list1中的圆重叠,而单个列表中的圆可以相互重叠。
list1是固定的,因此现在我必须找到list2中圆的正确位置。
我编写了这个简单的函数来识别两个圆是否重叠:
def overlap(x1, y1, x2, y2, r1, r2):
    distSq = (x1 - x2) * (x1 - x2) + (y1 - y2) * (y1 - y2)
    radSumSq = (r1 + r2) * (r1 + r2)
    if (distSq >= radSumSq):
        return False # no overlap
    else:
        return True  #overlap
这是列表1:
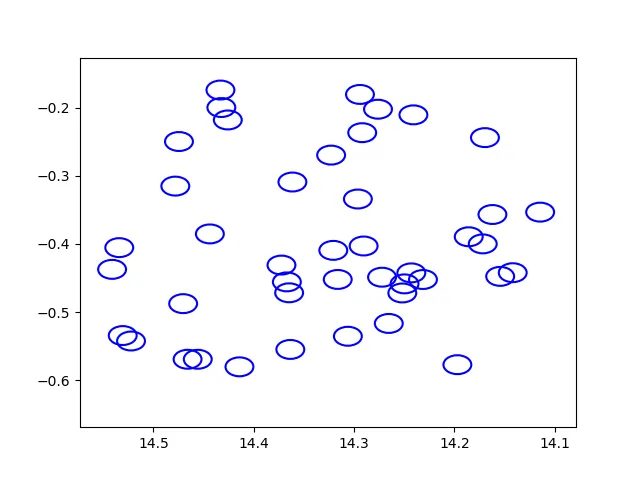
包含:
x=[14.11450195 14.14184093 14.15435028 14.16206741 14.16951752 14.17171097
 14.18569565 14.19700241 14.23129082 14.24083233 14.24290752 14.24968338
 14.2518959  14.26536751 14.27209759 14.27612877 14.2904377  14.29187012
 14.29409599 14.29618549 14.30615044 14.31624985 14.3206892  14.3228569
 14.36143875 14.36351967 14.36470699 14.36697292 14.37235737 14.41422081
 14.42583466 14.43226814 14.43319225 14.4437027  14.4557848  14.46592999
 14.47036076 14.47452068 14.47815609 14.52229309 14.53059006 14.53404236
 14.5411644 ]
y=[-0.35319126 -0.44222349 -0.44763246 -0.35669261 -0.24366629 -0.3998799
 -0.38940558 -0.57744932 -0.45223859 -0.21021004 -0.44250247 -0.45866323
 -0.47203487 -0.51684451 -0.44884869 -0.2018993  -0.40296811 -0.23641759
 -0.18019417 -0.33391538 -0.53565156 -0.45215255 -0.40939832 -0.26936951
 -0.30894437 -0.55504167 -0.47177047 -0.45573688 -0.43100587 -0.5805912
 -0.21770373 -0.199422   -0.17372169 -0.38522363 -0.56950212 -0.56947368
 -0.48770753 -0.24940367 -0.31492445 -0.54263926 -0.53460872 -0.4053807
 -0.43733299]
radius = 0.014
可拷贝、可粘贴...
x = [14.11450195,14.14184093,14.15435028,14.16206741,14.16951752,
     14.17171097,14.18569565,14.19700241,14.23129082,14.24083233,
     14.24290752,14.24968338,14.2518959,14.26536751,14.27209759,
     14.27612877,14.2904377,14.29187012,14.29409599,14.29618549,
     14.30615044,14.31624985,14.3206892,14.3228569,14.36143875,
     14.36351967,14.36470699,14.36697292,14.37235737,14.41422081,
     14.42583466,14.43226814,14.43319225,14.4437027,14.4557848,
     14.46592999,14.47036076,14.47452068,14.47815609,14.52229309,
     14.53059006,14.53404236,14.5411644]

y = [-0.35319126,-0.44222349,-0.44763246,-0.35669261,-0.24366629,
     -0.3998799,-0.38940558,-0.57744932,-0.45223859,-0.21021004,
     -0.44250247,-0.45866323,-0.47203487,-0.51684451,-0.44884869,
     -0.2018993,-0.40296811,-0.23641759,-0.18019417,-0.33391538,
     -0.53565156,-0.45215255,-0.40939832,-0.26936951,-0.30894437,
     -0.55504167,-0.47177047,-0.45573688,-0.43100587,-0.5805912,
     -0.21770373,-0.199422,-0.17372169,-0.38522363,-0.56950212,
     -0.56947368,-0.48770753,-0.24940367,-0.31492445,-0.54263926,
     -0.53460872,-0.4053807,-0.43733299]
我现在不确定该做什么,我的第一个想法是以列表1的x和y为基础,画出列表2的圆,并进行像 x+c 和 y+c 这样的操作,其中c是一个固定值。然后我可以调用我的重叠函数,如果有重叠,我就可以增加c 的值。
这样我就有了两个 for 循环。现在,我的问题是:
- 有没有办法避免使用
for循环? - 是否有一种聪明的方法来为列表1中的每个圆找到邻居(列表2中的圆),而不与列表2中的其他圆重叠?
list2的例子吗? - wwiix和y坐标的list1示例。样本list2类似于list1,具有相同数量的圆和相同的半径。 真实数据集更大,因此我想优化该过程,避免使用for循环。 - Alessandro Peca