基本上想知道使用Python进行这项任务的好方法是什么,以前我用一种类似于暴力破解的方式在Python中完成过这项任务,但它并不直观。如果有人能帮忙就好了。
如何制作一个邻接矩阵以模拟2D网格?
12
- user2341439
4
可能是Python中的邻接表和邻接矩阵的重复问题。 - Ashwini Chaudhary
我的意思是从给定的二维网格中创建一个矩阵,我理解了实现方法并已经实现了图形。我只是在寻找一些简单的方法来从二维网格中轻松地创建邻接矩阵。 - user2341439
你的意思是:如何生成一个M x N 网格图的邻接表? - Wesley Baugh
我猜应该差不多。 - user2341439
5个回答
12
对于按行排列的网格,邻接矩阵看起来像这样:
- 在一行内,相邻的数字形成两个平行对角线。每个子矩阵占据 Columns × Columns 的大小,并沿着大矩阵的对角线重复。
- 相邻的行形成一条对角线。它占据两个对角线,在行子矩阵外部略微偏移。
row 1 row 2 row 3
----- ----- -----  _
A A A 1 . . . . .   |
A A A . 1 . . . .   | row 1
A A A . . 1 . . .  _|
1 . . B B B 1 . .   |
. 1 . B B B . 1 .   | row 2
. . 1 B B B . . 1  _|
. . . 1 . . C C C   |
. . . . 1 . C C C   | row 3
. . . . . 1 C C C  _|
子矩阵有两个对角线,分别位于主对角线的两侧:
column
1 2 3 4 5 6
- - - - - -
. 1 . . . .  1 column
1 . 1 . . .  2
. 1 . 1 . .  3
. . 1 . 1 .  4
. . . 1 . 1  5
. . . . 1 .  6
def make_matrix(rows, cols):
    n = rows*cols
    M = matrix(n,n)
    for r in xrange(rows):
        for c in xrange(cols):
            i = r*cols + c
            # Two inner diagonals
            if c > 0: M[i-1,i] = M[i,i-1] = 1
            # Two outer diagonals
            if r > 0: M[i-cols,i] = M[i,i-cols] = 1
对于一个 3 × 4 的网格,矩阵如下:
. 1 . . 1 . . . . . . .
1 . 1 . . 1 . . . . . .
. 1 . 1 . . 1 . . . . .
. . 1 . . . . 1 . . . .
1 . . . . 1 . . 1 . . .
. 1 . . 1 . 1 . . 1 . .
. . 1 . . 1 . 1 . . 1 .
. . . 1 . . 1 . . . . 1
. . . . 1 . . . . 1 . .
. . . . . 1 . . 1 . 1 .
. . . . . . 1 . . 1 . 1
. . . . . . . 1 . . 1 .
- Markus Jarderot
2
你在 make_matrix 中使用的“matrix”函数是什么? - Max Mumford
matrix(r, c) 是一个构造函数,用于创建一个 r x c 的矩阵。 - Markus Jarderot9
一种很好的方法是使用Kronecker product,它允许您快速构建一个像Markus Jarderot描述的矩阵。
下面是一个具有周期边界条件的晶格的代码。
下面是一个具有周期边界条件的晶格的代码。
import scipy.linalg as la
import numpy as np
offdi = la.circulant([0,1,0,0,1])
I = np.eye(5)

import matplotlib.pyplot as plt
A = np.kron(offdi,I) + np.kron(I,offdi)
plt.matshow(A)
plt.show()

这里np.kron(I,offdi)将矩阵offdi放置在主块对角线中,该矩阵编码了网格行内的连接。这是通过Kronecker乘积I实现的。np.kron(offdi,I)则相反:在上下的下一个块对角线中放置一个单位矩阵。这意味着一个节点与其同一列中的连续行中的内容相连。
如果您想要网格不是周期性的,而是只有边界没有链接,可以使用Toeplitz构造而不是循环构造:la.toeplitz([0,1,0,0,0])
- guillefix
5
我建议首先手动生成几个示例的邻接矩阵,看是否能发现(易于编程的)规律。邻接矩阵取决于节点的标签(以何种顺序标记),因此不同的排序可能会产生更容易或更难在生成函数中编码的模式。
这是一个有趣的问题,虽然我现在无法给出确切答案,但我会继续思考(也许这可以帮助您或其他人找到解决方案)。
这是一个有趣的问题,虽然我现在无法给出确切答案,但我会继续思考(也许这可以帮助您或其他人找到解决方案)。
- Wesley Baugh
1
PySAL(Python空间分析库)包含一个创建邻接矩阵的函数 -
对于稀疏表示:
import pysal

w = pysal.lat2W(2, 2) # make a 2x2 lattice with rook connectivity
# <pysal.weights.weights.W at 0x257aa470128>
对于稀疏表示:
w.neighbors
# {0: [2, 1], 2: [0, 3], 1: [0, 3], 3: [1, 2]}
对于完整的数组表示:
w.full()[0]
# array([[0., 1., 1., 0.],
#        [1., 0., 0., 1.],
#        [1., 0., 0., 1.],
#        [0., 1., 1., 0.]])
请查看https://pysal.readthedocs.io/en/latest/users/tutorials/weights.html#spatial-weights。
- Brian Burns
0
这里有一个纯NumPy解决方案,希望更加直观。关键是通过考虑节点的x、y坐标来将节点视为2D网格,并连接距离它们+-1 x或y的节点。此解决方案不会在网格周围包装。
这将产生: {{link1: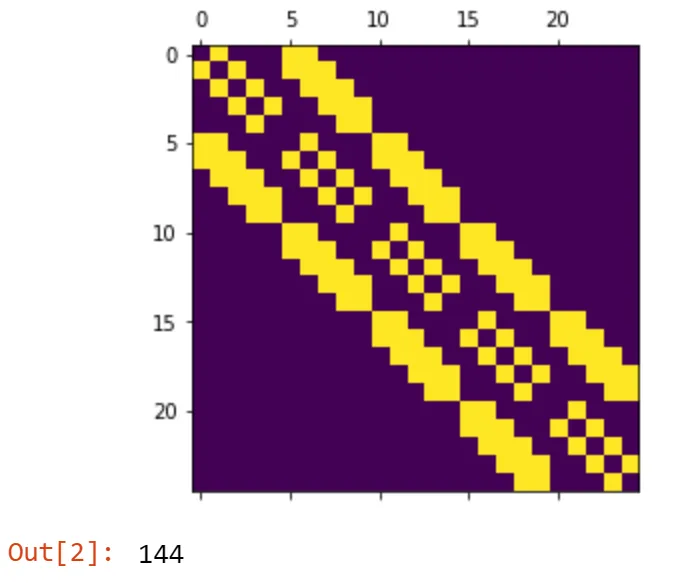 }}。
}}。
def grid_adj(N: int) -> np.ndarray:
  """Creates a 2D grid adjacency matrix."""
  sqN = np.sqrt(N).astype(int)  # There will sqN many nodes on x and y
  adj = np.zeros((sqN, sqN, sqN, sqN), dtype=bool)
  # Take adj to encode (x,y) coordinate to (x,y) coordinate edges
  # Let's now connect the nodes
  for i in range(sqN):
    for j in range(sqN):
      # Connect x=i, y=j, to x-1 and x+1, y-1 and y+1
      adj[i, j, max((i-1), 0):(i+2), max((j-1), 0):(j+2)] = True
      # max is used to avoid negative slicing, and +2 is used because
      # slicing does not include last element.
  adj = adj.reshape(N, N)  # Back to node-to-node shape
  # Remove self-connections (optional)
  adj ^= np.eye(N, dtype=bool)
  return adj

# Visualise
plt.matshow(grid_adj(25))
plt.show()
# Print number of edges
np.flatnonzero(adj).size
这将产生: {{link1:
}}。- nuric
网页内容由stack overflow 提供, 点击上面的可以查看英文原文,
原文链接
原文链接