我想创建一个图表,将两个之前生成的图表重叠在一起。结果非常接近我的想法,但是我无法调整每个条形图之间的间隔。以下是我用来生成箱线图的代码:
a <- ggplot(aes(y = SCORE, x = DATE, fill = CATEGORY), data = data_R1000) +          geom_boxplot() + ylim(20,100) + labs(title = "Russell 1000") + theme(legend.position="bottom") + scale_fill_hue(c=150, l=70)

b <- ggplot(aes(y = SCORE, x = DATE, fill = CATEGORY), data = data_R1000) + geom_boxplot(width=0.8) + ylim(20,100) + labs(title = "US_MARKETOR") + theme(legend.position="bottom") + theme(panel.background = element_rect(fill = "transparent",colour = NA)) + theme(panel.grid.major = element_blank(), panel.grid.minor = element_blank()) + scale_fill_hue(c=50, l=85)

# extract gtable
g1 <- ggplot_gtable(ggplot_build(a))
g2 <- ggplot_gtable(ggplot_build(b))

# overlap the panel of 2nd plot on that of 1st plot
pp <- c(subset(g1$layout, name == "panel", se = t:r))
g <- gtable_add_grob(g1, g2$grobs[[which(g2$layout$name == "panel")]], pp$t, pp$l, pp$b, pp$l)

## what I dd is to plot a new viewports.
vp=viewport(x=0.5,y=0.5,height=1,width=1)
pushViewport(vp)
grid.draw(g)
upViewport()
以下是结果展示: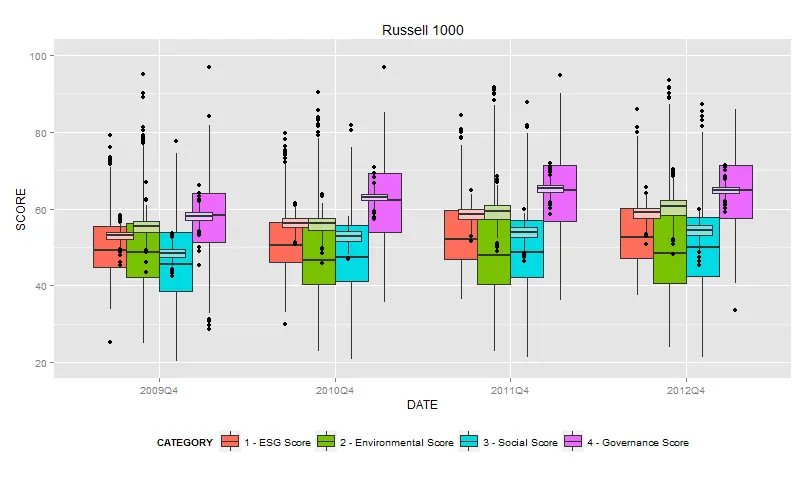
我想知道如何使上层的箱线图垂直线可以与下面的重叠,同时保持较窄的上部条形图(即,如何添加连续条之间的间隔,以便它们不紧挨着彼此?)
* 另外,我还需要在图中水平移动所有箱线图。有没有办法调整箱线图的x轴位置而不改变x轴?*
非常感谢您的帮助!
position = position_dodge(width = 1.5)有帮助吗? - mnel