我正在使用 jqPlot 创建一个柱状图,但遇到了一些问题。
问题1: 图表上的第一个和最后一个柱被削减了。只显示了一半。
问题2: 我不想让我的数据点跨越整个 x 轴。有没有方法让数据不跨越整个 x 轴?
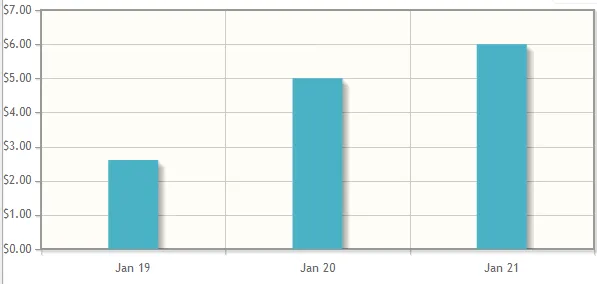
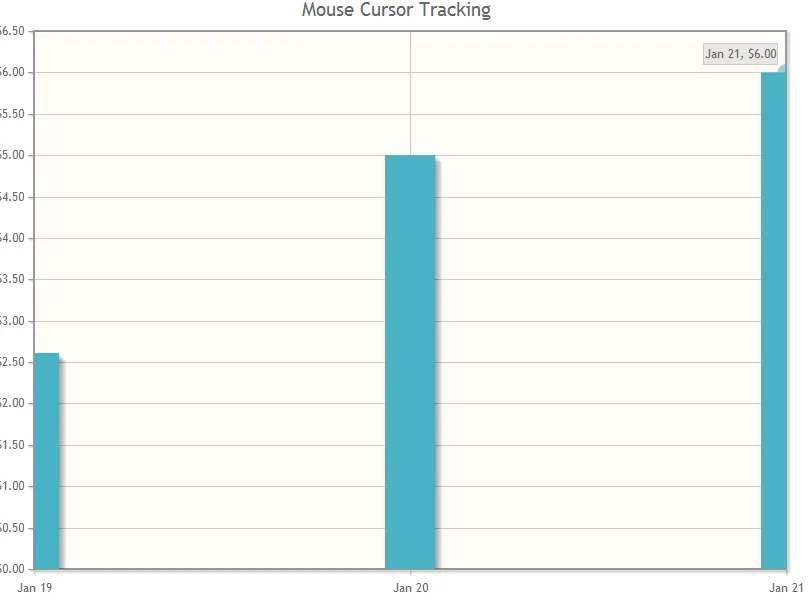 示例: 这是它现在的效果。
这是我传递给它的数据。
var chartData = [["19-Jan-2012",2.61],["20-Jan-2012",5.00],["21-Jan-2012",6.00]]
这是我使用的jQuery代码。
 // Plot chart
        function PlotChart(chartData, numberOfTicks) {
            $.jqplot.config.enablePlugins = true;
                 var plot2 = $.jqplot('chart1', [chartData], {
                    title: 'Mouse Cursor Tracking',
                     seriesDefaults:{
                         renderer: $.jqplot.BarRenderer,
                         rendererOptions: {
                            barPadding: 1,
                            barMargin: 15,
                            barDirection: 'vertical',
                            barWidth: 50
                        },
                        pointLabels: { show: true }
                    },
                    axes: {
                        xaxis: {
                            pad: 0,       // a factor multiplied by the data range on the axis to give the
                            numberTicks: numberOfTicks,
                            renderer:  $.jqplot.DateAxisRenderer,  // renderer to use to draw the axis,
                            tickOptions: {
                                formatString: '%b %#d'   // format string to use with the axis tick formatter
                            }
                        },
                        yaxis: {
                            tickOptions: {
                                formatString: '$%.2f'
                            }
                        }
                    },
                    highlighter: {
                        sizeAdjust: 7.5
                    },
                    cursor: {
                        show: true
                    }
                });
            }