如何在Matplotlib工具栏中设置鼠标坐标的大小?

3

我想增加鼠标坐标的大小(位于导航工具栏中的右侧),mpl.rcParams['font.size'] = 35 改变绘图中文本的大小,但不影响工具栏中的文本。是否有rcParams或其他设置大小的方法。

我已经花了将近一天的时间来尝试解决这个问题。

enter image description here '''

import numpy as np
import matplotlib as mpl
import matplotlib.pyplot as plt

mpl.rcParams['font.size'] = 35
x=np.arange(0,100)
y=np.sin(np.pi*x/10)
plt.plot(x,y)

plt.title('Sin(x)')
plt.show()

'''

2个回答

0

这不是一个完整的答案,但我看不到在评论中放几行代码的方法。

我能够像这样解决Qt GUI应用程序中的问题:

self.toolbar = NavigationToolbar2QT(self.view, self)
self.toolbar.setStyleSheet("font-size: 12px;")

0

我不确定是否可以更改特定的字体大小。但是,作为替代方案,可以使用text方法绘制鼠标坐标。为此,我创建了一个带有两个轴的图形。顶部轴最小,用于使用上述文本方法绘制鼠标坐标,而底部轴用于您的绘图。此外,我定义了一个函数,该函数将在鼠标移动时调用。此函数负责更新鼠标坐标。请参见下面的代码:

import numpy as np
import matplotlib.pyplot as plt

# Set option(s)
plt.rcParams['font.size'] = 15

# Generate data to plot
x = np.arange(0, 100)
y = np.sin(np.pi * x / 10)

# Create a figure with two axes:
# Top axes   :  Used to draw text containing the coordinates of the mouse
# Bottom axes:  Used to plot the data
fig, ax = plt.subplots(nrows=2, 
                       ncols=1, 
                       # Note: default figsize is [6.4, 4.8] in inches
                       figsize=(6.4, 5.6), 
                       # Using height_ratios, we make the top axes small
                       # and the bottom axes as big as usual
                       gridspec_kw={'height_ratios': [0.8 / 5.6, 4.8 / 5.6]}
                       )

# ax[0] is where the coordinates will be shown, so remove the x- and y-axis
ax[0].axis('off')

# Set default text on the top axes
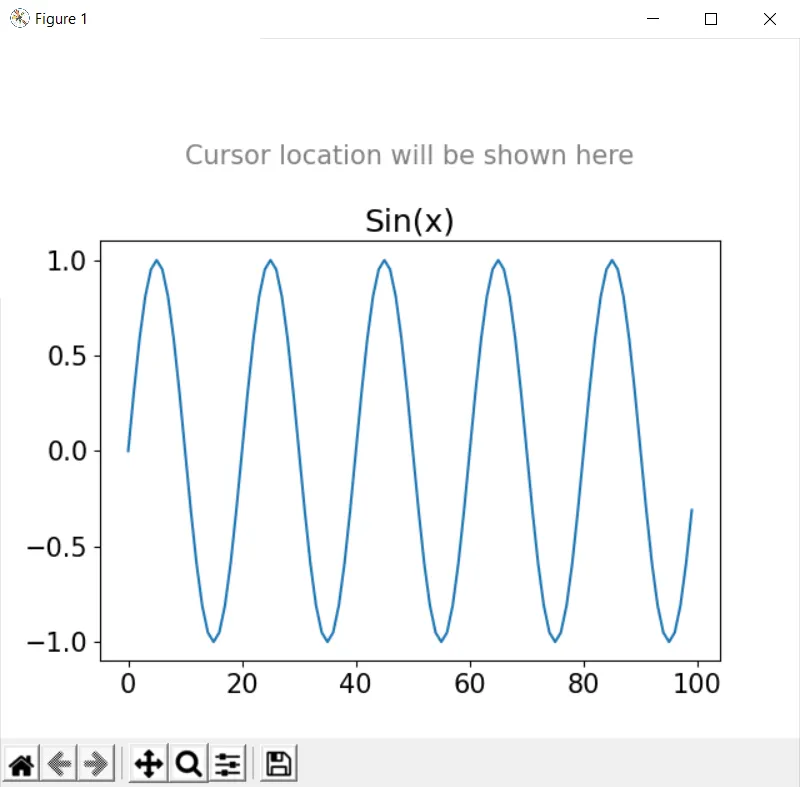
default_text = "Cursor location will be shown here"
ax[0].text(0.5, 0.5, default_text, va='center', ha='center', color='grey')

# Plot the data on the bottom axes (ax[1])
ax[1].plot(x, y)
ax[1].set_title("Sin(x)")

# Define a function which is called when the location of the mouse changes
def update_mouse_coordinates(ax, text, event):
    
    # Don't print coordinates if not on bottom axes
    if event.inaxes == ax or event.xdata==None or event.ydata==None:
        ax.texts[0].set_text(text)
        plt.draw()
        return
    
    # Show mouse coordinates to user
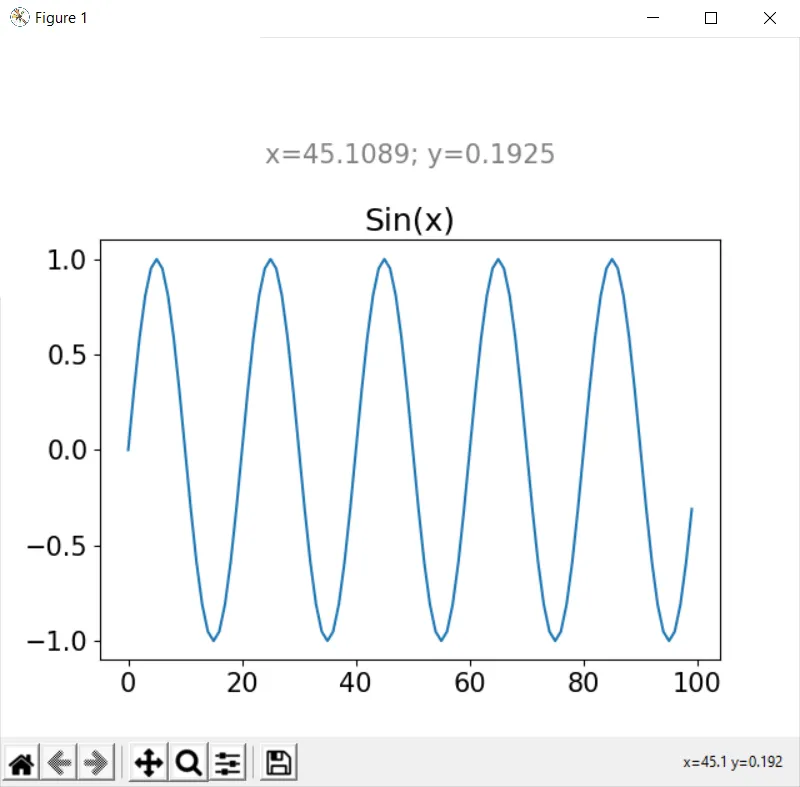
    ax.texts[0].set_text(f"x={event.xdata:.4f}; y={event.ydata:.4f}")
    plt.draw()


plt.connect('motion_notify_event', 
            # Using a lambda expression, we supply the top axes and the default
            # text to this function (our resulting function may only have one
            # argument!)
            lambda event: update_mouse_coordinates(ax[0], default_text, event)
            )

# Show the plot
plt.show()

无论鼠标在哪里,只要不在底部坐标轴(即您的绘图区域),它看起来都是这样的: Mouse outside bottom axes 一旦您的鼠标在底部坐标轴内部的某个位置,您将获得以下行为: Mouse inside bottom axes

网页内容由stack overflow 提供, 点击上面的
可以查看英文原文,
原文链接