我这里有一行代码,使用了OpenCV的Python绑定:
cv2.rectangle(img, (box[1], box[0]), (box[3], box[2]), (255,0,0), 4)
这会在图像img上绘制一条红色矩形,线条粗细为4。
但是有没有办法使矩形的线条风格更加独特?并不需要太多,只需要点线或虚线就可以了。
我这里有一行代码,使用了OpenCV的Python绑定:
cv2.rectangle(img, (box[1], box[0]), (box[3], box[2]), (255,0,0), 4)
这会在图像img上绘制一条红色矩形,线条粗细为4。
但是有没有办法使矩形的线条风格更加独特?并不需要太多,只需要点线或虚线就可以了。
import cv2
import numpy as np
def drawline(img,pt1,pt2,color,thickness=1,style='dotted',gap=20):
dist =((pt1[0]-pt2[0])**2+(pt1[1]-pt2[1])**2)**.5
pts= []
for i in np.arange(0,dist,gap):
r=i/dist
x=int((pt1[0]*(1-r)+pt2[0]*r)+.5)
y=int((pt1[1]*(1-r)+pt2[1]*r)+.5)
p = (x,y)
pts.append(p)
if style=='dotted':
for p in pts:
cv2.circle(img,p,thickness,color,-1)
else:
s=pts[0]
e=pts[0]
i=0
for p in pts:
s=e
e=p
if i%2==1:
cv2.line(img,s,e,color,thickness)
i+=1
def drawpoly(img,pts,color,thickness=1,style='dotted',):
s=pts[0]
e=pts[0]
pts.append(pts.pop(0))
for p in pts:
s=e
e=p
drawline(img,s,e,color,thickness,style)
def drawrect(img,pt1,pt2,color,thickness=1,style='dotted'):
pts = [pt1,(pt2[0],pt1[1]),pt2,(pt1[0],pt2[1])]
drawpoly(img,pts,color,thickness,style)
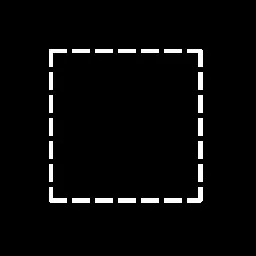
im = np.zeros((800,800,3),dtype='uint8')
s=(234,222)
e=(500,700)
drawrect(im,s,e,(0,255,255),1,'dotted')
cv2.imshow('im',im)
cv2.waitKey()
you can use LineIterator and get any style you want in a few lines of code
void lineDot(OutputArray img, const Point& pt1, const Point& pt2, const Scalar& color, const vector<bool>& pattern){
    LineIterator it(img.getMat(), pt1, pt2, LINE_8); // LINE_AA is not supported here
    for(auto i=0; i<it.count; i++, it++){
        if(pattern[i%pattern.size()]){ // use any pattern of any length, dotted is {0,0,1}, dashed is {0,0,0,1,1,1} etc
            (*it)[0] = color.val[0];
            (*it)[1] = color.val[1];
            (*it)[2] = color.val[2];
        }
    }
}
OpenCV目前不支持线条属性,除了线条的粗细和抗锯齿。
这是一种在Python/OpenCV中绘制虚线的方法。
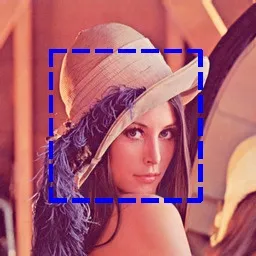
将矩形作为白色线条在黑色背景上绘制,然后在该掩模上绘制一组黑色线条(水平和垂直线条),以在白色线条中间留出间隔。线条的粗细将控制间隔的大小。然后使用该掩模,在图像上绘制黑色线条的位置处绘制黑色。
输入:
import cv2
import numpy as np
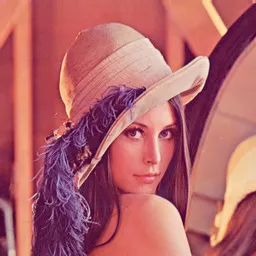
# read the image
img = cv2.imread('lena.jpg')
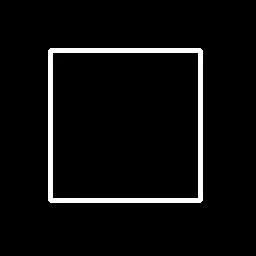
# draw white lines on black as mask
mask = np.zeros_like(img)
cv2.rectangle(mask, (50,50), (200,200), (255,255,255), 4)
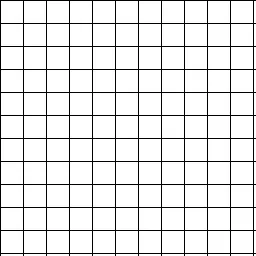
# draw grid of black lines on white
grid = np.full_like(img, (255,255,255))
dx, dy = 23, 23 # spacing cannot be evenly divisible with dimensions of rectangle
grid[:,::dx,:] = [0,0,0]
grid[::dy,:,:] = [0,0,0]
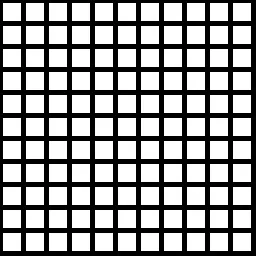
# thicken grid lines
kernel = cv2.getStructuringElement(cv2.MORPH_RECT, (5,5))
grid2 = cv2.morphologyEx(grid, cv2.MORPH_ERODE, kernel)
# multiply grid with mask
mask2 = cv2.multiply(mask, grid2)
mask2 = cv2.cvtColor(mask2, cv2.COLOR_BGR2GRAY)
# use mask to draw blue dashed rectangle on image
result = img.copy()
result[mask2==255] = [255,0,0]
# save results
cv2.imwrite('lena_mask.jpg', mask)
cv2.imwrite('lena_grid.jpg', grid)
cv2.imwrite('lena_grid2.jpg', grid2)
cv2.imwrite('lena_mask2.jpg', mask2)
cv2.imwrite('lena_dashed_lines.jpg', result)
# show results
cv2.imshow('mask', mask)
cv2.imshow('grid', grid)
cv2.imshow('grid2', grid2)
cv2.imshow('mask2', mask2)
cv2.imshow('result', result)
cv2.waitKey(0)
矩形遮罩:
黑色网格:
网格加粗:
结果:
OpenCV目前没有内置的绘制虚线的方法,正如Adi Shavit和其他人在这里所述。
然而,有一个解决方法可以使用cv2.line()函数来绘制虚线。一种方法是绘制短线段并在它们之间留出间隔,以呈现虚线的外观。以下是一个示例代码片段,演示了这种技术:
import cv2

# Create a black image
img = np.zeros((512, 512, 3), np.uint8)

# Draw a dashed line
start_point = (100, 100)
end_point = (400, 100)
color = (0, 255, 0)
thickness = 2

# Define the length of the line segments and gaps
segment_length = 10
gap_length = 5

# Calculate the length and direction of the line
dx = end_point[0] - start_point[0]
dy = end_point[1] - start_point[1]
line_length = np.sqrt(dx*dx + dy*dy)
x_unit = dx / line_length
y_unit = dy / line_length

# Draw the line segments
current_point = start_point
while line_length >= segment_length:
    end_point = (int(current_point[0] + segment_length*x_unit), int(current_point[1] + segment_length*y_unit))
    cv2.line(img, current_point, end_point, color, thickness)
    current_point = (int(end_point[0] + gap_length*x_unit), int(end_point[1] + gap_length*y_unit))
    line_length -= segment_length + gap_length

# Display the image
cv2.imshow('Dashed Line', img)
cv2.waitKey(0)
cv2.destroyAllWindows()
from PIL import Image, ImageDraw

# Create a black image
img = Image.new('RGB', (512, 512), (0, 0, 0))

# Draw a dashed line
draw = ImageDraw.Draw(img)
start_point = (100, 100)
end_point = (400, 100)
color = (0, 255, 0)
dash_length = 10
gap_length = 5
dash = [dash_length, gap_length]
draw.line((start_point, end_point), fill=color, width=2, joint='curve', dash=dash)

# Display the image
img.show()
@staticmethod
def draw_dashed_line(image, point1: tuple[int, int], point2: tuple[int, int], color: tuple[int, int, int], thickness: int = 1,
                     dash_size: int = 20):
    """
    This assumes the line is vertical or horizontal
    :param image: image to draw the line onto
    :param point1: (x, y)
    :param point2: (x, y)
    :param color: color of the line
    :param thickness: thickness of the line
    :param dash_size: length of the gap and dash
    :return:
    """
    x1 = point1[0]
    y1 = point1[1]
    x2 = point2[0]
    y2 = point2[1]
    if x1 == x2:
        # vertical line
        if y2 > y1:
            max_y = y2
            min_y = y1
        elif y1 > y2:
            max_y = y1
            min_y = y2
        else:
            raise ValueError("Both points cannot be identical")

        for y in range(min_y, max_y, dash_size):
            cv2.line(image, (x1, y), (x1, y + round(dash_size/2)), color, thickness)
    elif y1 == y2:
        # horizontal line
        if x2 > x1:
            max_x = x2
            min_x = x1
        elif x1 > x2:
            max_x = x1
            min_x = x2

        for x in range(min_x, max_x, dash_size):
            cv2.line(image, (x, y1), (x + round(dash_size/2), y1), color, thickness)
    else:
        raise ValueError("Line must be horizontal or vertical")

def draw_dashed_bounding_box(self, image, centre_point: tuple[int, int], size: tuple[int, int], color: tuple[int, int, int],
                             thickness: int, dash_length: int = 20) -> None:
    """
    Draw a rectangular bounding box
    :param image: image to draw the bounding box onto
    :param centre_point: centre point of the bounding box
    :param size: (height, width) of the bounding box
    :param color: RGB colour of the bounding box
    :param thickness: thickness of lines
    :param dash_length: length of gap and lines for dashes in bounding box lines
    :return:
    """
    min_x = int(centre_point[0] - (size[0] / 2))
    min_y = int(centre_point[1] - (size[1] / 2))
    max_x = int(centre_point[0] + (size[0] / 2))
    max_y = int(centre_point[1] + (size[1] / 2))
    points = [(min_x, min_y), (max_x, min_y), (max_x, max_y), (min_x, max_y)]
    end = points[0]
    points.append(points.pop(0))
    for point in points:
        start = end
        end = point
        self.draw_dashed_line(image, start, end, color, thickness, dash_length)
cv::Point P1, P2;

P1.y = 50;
P2.y = 50;

int dot_gap = 50;
int dot_width = 50;

for( int i=0 ; i < in_img.cols; (i = i+d_width) ) {

    P1.x = i;
    P2.x = i + dot_width;
    cv::line(in_img, P1, P2, cv::Scalar(0, 255, 255), 2, cv::LINE_8);
}