考虑以下数据集:
ig_5 <- data.frame(
  category = c("A", "B", "C", "D", "E", "F"),
  prop = c(0.1, 0.2, 0.15, 0.25, 0.05, 0.25)
) %>%
  mutate(lab.ypos = cumsum(prop) - 0.5*prop)
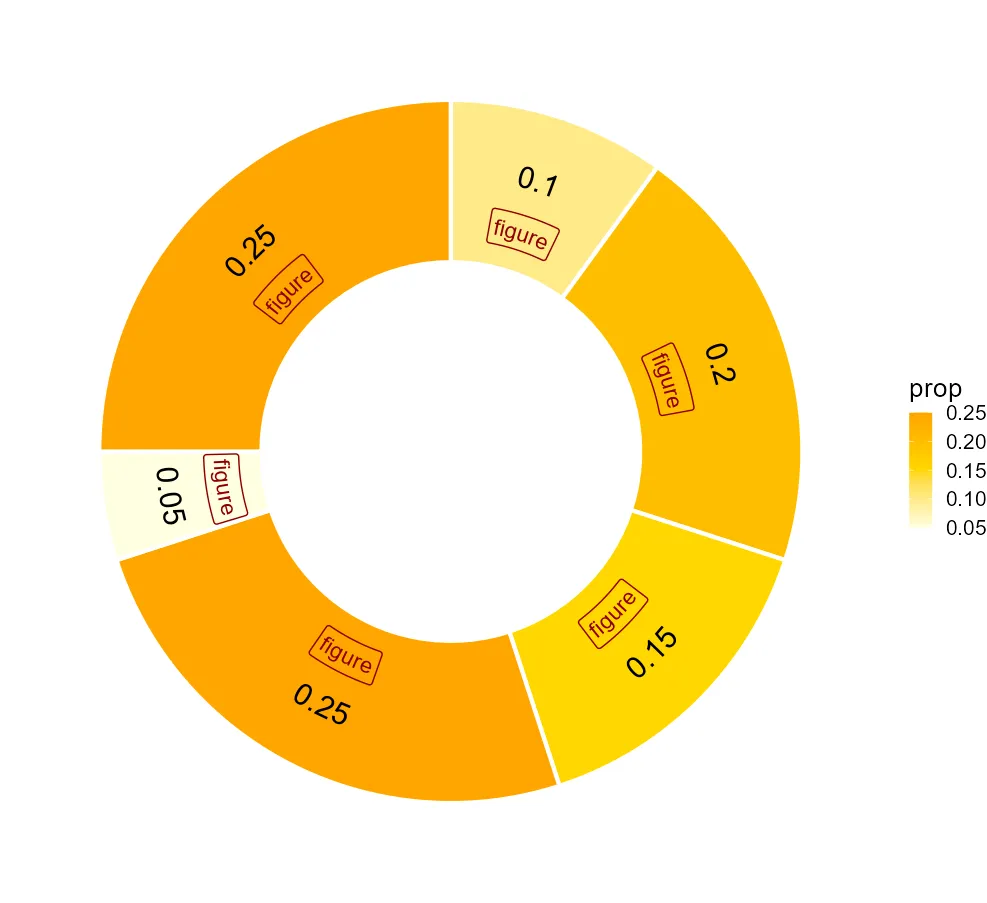
我使用以下代码创建了一个甜甜圈图表:
ggplot(ig_5, aes(x = 2, y = prop, fill = prop)) +
  geom_bar(stat = "identity", color = "white") +
  coord_polar(theta = "y", start = 0) +
  geom_text(aes(y = lab.ypos, label = prop), color = "black", size = 5) +
  xlim(.5, 2.5)
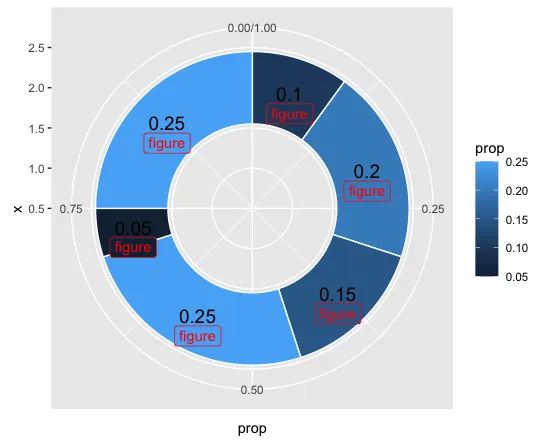
如您所见,值标签放置在每个类别的中间。现在,我需要将图形放置在每个值标签的正下方。我不能只是将新对象粘贴到值上,因为文本和图形的颜色不同。因此,我想象应该有一种方法可以使用值标签的坐标(x = 2,y = lab.ypos = cumsum(prop)-0.5 * prop)来定位所需的图形。
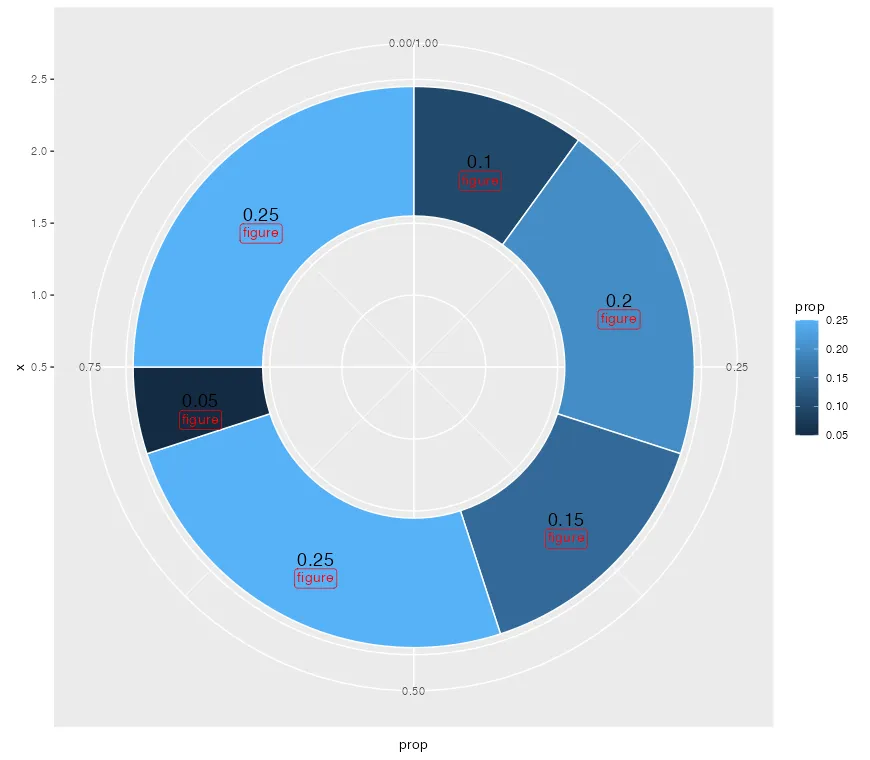
我使用geom_label添加了新图形,并给它一个与值标签的XY坐标成比例的位置。然而,我还没有成功。这是我尝试过的一个示例。
ig_5 <- data.frame(
  category = c("A", "B", "C", "D", "E", "F"),
  prop = c(0.1, 0.2, 0.15, 0.25, 0.05, 0.25)) %>%
  mutate(lab.ypos = cumsum(prop) - 0.5*prop,
         lab.ypos2 = cumsum(prop) + 0.3*prop)


ggplot(ig_5, aes(x = 2, y = prop, fill = prop)) +
  geom_bar(stat = "identity", color = "white") +
  coord_polar(theta = "y", start = 0) +
  geom_text(aes(y = lab.ypos, label = prop), color = "black", size = 5) +
  geom_label(aes(y = lab.ypos,
                 x = c(1.85, 2.1, 2.2, 1.95, 1.8, 1.85),
                 label = "figure"),
             color = 'red') +
  xlim(.5, 2.5)
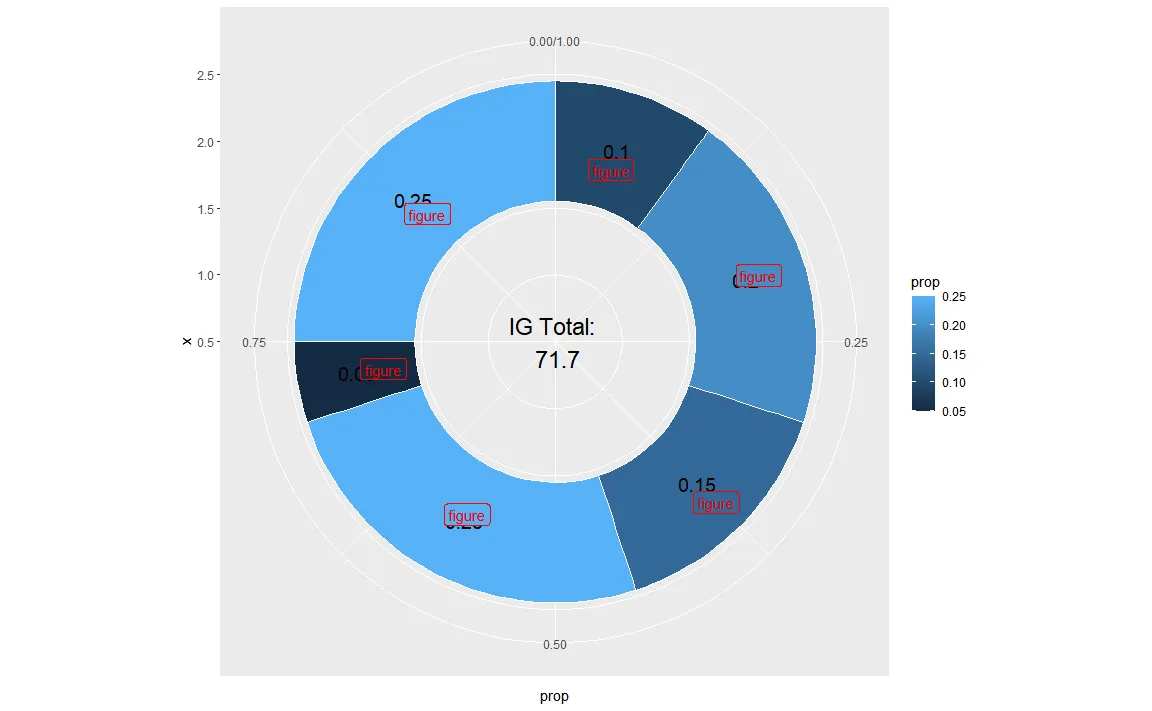
而我得到的结果是: