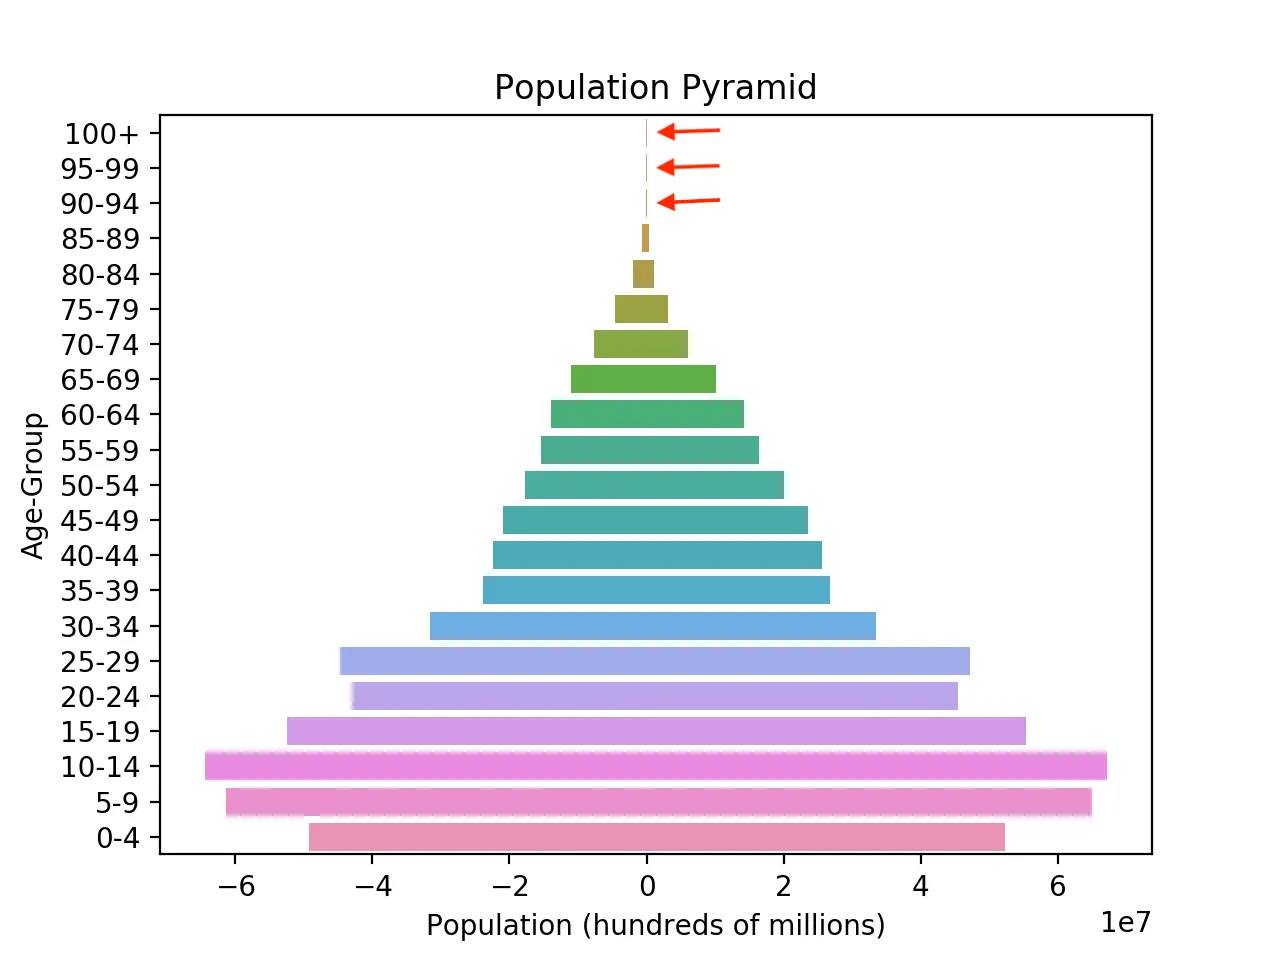
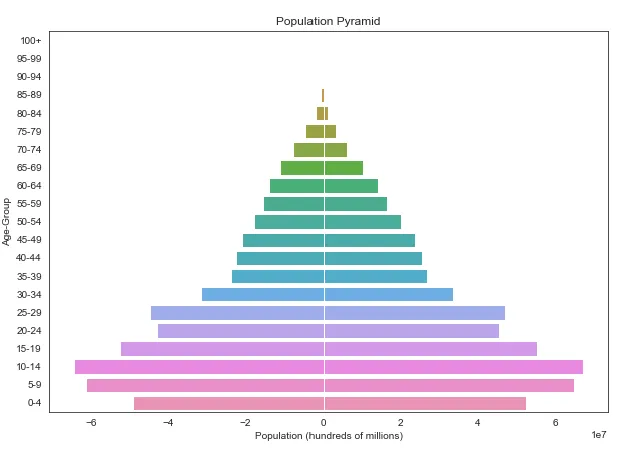
我正在尝试使用seaborn从pandas df构建人口金字塔。问题是一些数据没有显示出来。如您所见,我创建的图中有一些缺失数据。Y轴刻度为21,df的年龄类别也为21,为什么它们不匹配?我错过了什么?
这是我写的代码:
 import pandas as pd
 import matplotlib.pyplot as plt
 import numpy as np
 import seaborn as sns

 df = pd.DataFrame({'Age': ['0-4','5-9','10-14','15-19','20-24','25-29','30-34','35-39','40-44','45-49','50-54','55-59','60-64','65-69','70-74','75-79','80-84','85-89','90-94','95-99','100+'],
                    'Male': [-49228000, -61283000, -64391000, -52437000, -42955000, -44667000, -31570000, -23887000, -22390000, -20971000, -17685000, -15450000, -13932000, -11020000, -7611000, -4653000, -1952000, -625000, -116000, -14000, -1000],
                    'Female': [52367000, 64959000, 67161000, 55388000, 45448000, 47129000, 33436000, 26710000, 25627000, 23612000, 20075000, 16368000, 14220000, 10125000, 5984000, 3131000, 1151000, 312000, 49000, 4000, 0]})


AgeClass = ['100+','95-99','90-94','85-89','80-84','75-79','70-74','65-69','60-64','55-59','50-54','45-49','40-44','35-39','30-34','25-29','20-24','15-19','10-14','5-9','0-4']

bar_plot = sns.barplot(x='Male', y='Age', data=df, order=AgeClass)

bar_plot = sns.barplot(x='Female', y='Age', data=df, order=AgeClass)

bar_plot.set(xlabel="Population (hundreds of millions)", ylabel="Age-Group", title = "Population Pyramid")