来自eCharts的不同颜色条形图

26

我想创建一个不同颜色的条形图。星期一蓝色,星期二红色,星期三绿色。请问如何编写代码?Line itemStyle: {normal: {color: 'blue','red', 'green'}}并没有起作用。
这段代码来自于Echarts网站。

 <html style="height: 100%">
       <head>
           <meta charset="utf-8">
       </head>
       <body style="height: 100%; margin: 0">
           <div id="container" style="height: 100%"></div>
           <script type="text/javascript" src="http://echarts.baidu.com/gallery/vendors/echarts/echarts.min.js"></script>
           <script type="text/javascript">
    var dom = document.getElementById("container");
    var myChart = echarts.init(dom);
    var app = {};
    option = null;
    option = {
        xAxis: {
            type: 'category',
            data: ['Mon', 'Tue', 'Wed']
        },
        yAxis: {
            type: 'value'
        },
        series: [{
            itemStyle: {normal: {color: 'blue'}},
            data: [120, 200, 150],
            type: 'bar'
        }]
    };
    ;
    if (option && typeof option === "object") {
        myChart.setOption(option, true);
    }
           </script>
       </body>
    </html>
7个回答

47

这是我的解决方案:

    var option = {
    xAxis: {
        type: 'category',
        data: ['Mon', 'Tue', 'Wed']
    },
    yAxis: {
        type: 'value'
    },
    series: [{
        data: [
            {
                value: 120,
                itemStyle: {color: 'blue'},
            },
            {
                value: 200,
                itemStyle: {color: 'red'},
            },
            {
                value: 150,
                itemStyle: {color: 'green'},
            }
        ],
        type: 'bar'
    }],
    graph: {
        color: colorPalette
    }
};

https://plnkr.co/edit/vFK1qeMfMCXGx8Gdn1d8?p=preview

->

谢谢你提供这个。你能指向一些好的学习资源吗? - आनंद
2
我认为好的资源是文档:https://ecomfe.github.io/echarts-doc/public/en/api.html#echarts - coudy.one
@coudy.one 我该如何处理动态数据?如果数据没有固定的值.. 这里是使用3个项目进行固定。对于我的情况,数据是动态的,随时会变化.. - surazzarus
@surazzarus 我已经添加了一个加载动态数据的示例:https://plnkr.co/edit/e5Ob1xn4h8VydpGUl3Ax?p=preview 当您单击“渲染”按钮时,图表会读取新数据。 - coudy.one
@coudy.one 感谢提供文档链接!我在查看相同的中文版本时遇到了困难:https://echarts.baidu.com/tutorial.html#5%20%E5%88%86%E9%92%9F%E4%B8%8A%E6%89%8B%20ECharts - rottweiler
显示剩余2条评论

10

对于我来说,最佳解决方案无法工作。 根据他们的文档,似乎lineStyle现在有两个子元素,你可以利用'normal'和'emphasis'。我不得不像这样修改它以覆盖默认颜色:

    var option = {
    xAxis: {
        type: 'category',
        data: ['Mon', 'Tue', 'Wed']
    },
    yAxis: {
        type: 'value'
    },
    series: [{
        data: [
            {
                value: 120,
                itemStyle: { normal: { color: 'blue' } },
            },
            {
                value: 200,
                itemStyle: { normal: { color: 'red' } },
            },
            {
                value: 150,
                itemStyle: { normal: { color: 'green' } },
            }
        ],
        type: 'bar'
    }],
    graph: {
        color: colorPalette
    }
};

4

2019年6月,我面对需要根据数值显示不同颜色的情况,我的解决方案是创建不同的数据系列并使用堆积图。例如,我需要创建一个图表,绿色柱表示通过的数值,黄色柱表示未通过的数值。下面是我的实现:

var data = {};
data.legendData = ['Sales','HR','Engineering'];
data.greenSeriesData = ['-',96.38,98.43];
data.yellowSeriesData = [44.23,'-','-'];

var option = {
    title: {
        text: '2019 Progress',
        left: 'center'
    },
    xAxis: {
        type: 'category',
        data: data.legendData
    },
    yAxis: {
        type: 'value',
        axisLabel: {
            formatter: function (val) {
                return (val) + '%';
            }
        }
    },
    series: [{
        data: data.greenSeriesData,
        type: 'bar',
        stack: 'colorbyvalue',
        label: {
            show: true,
            position: 'insideTop',
            formatter: "{c}%",
            color: '#000000'
        },
        barWidth: 50,
        itemStyle: {
            color: 'green'
        }
    },
    {
        data: data.yellowSeriesData,
        type: 'bar',
        stack: 'colorbyvalue',
        label: {
            show: true,
            position: 'insideTop',
            formatter: "{c}%",
            color: '#000000'
        },
        barWidth: 50,
        itemStyle: {
            color: 'yellow'
        }
    }],
    animation: false
};

1
经过一天的研究,得到了这个答案 => 使用seriesIndex作为参数添加itemStyle。
var option = {
xAxis: {
    type: 'category',
    data: ['Mon', 'Tue', 'Wed']
},
yAxis: {
    type: 'value'
},
series: [{
    data: [ 120,200,150],
    type: 'bar',
    itemStyle: {
      // HERE IS THE IMPORTANT PART
      color: (seriesIndex) => yourCustomFunctionName(seriesIndex) // you will get access to array data passed and its index values
     },
    }],
    graph: {
    color: colorPalette
 }
};

1

现在有一个新的colorBy选项:https://echarts.apache.org/zh/option.html#series-bar.colorBy

用法:

option = {
    xAxis: {
        type: 'category',
        data: ['Mon', 'Tue', 'Wed', 'Thu', 'Fri', 'Sat', 'Sun']
    },
    yAxis: {
        type: 'value'
    },
    series: [{
        data: [120, 200, 150, 80, 70, 110, 130],
        type: 'bar',
        colorBy: 'data' // <---
    }]
};

0

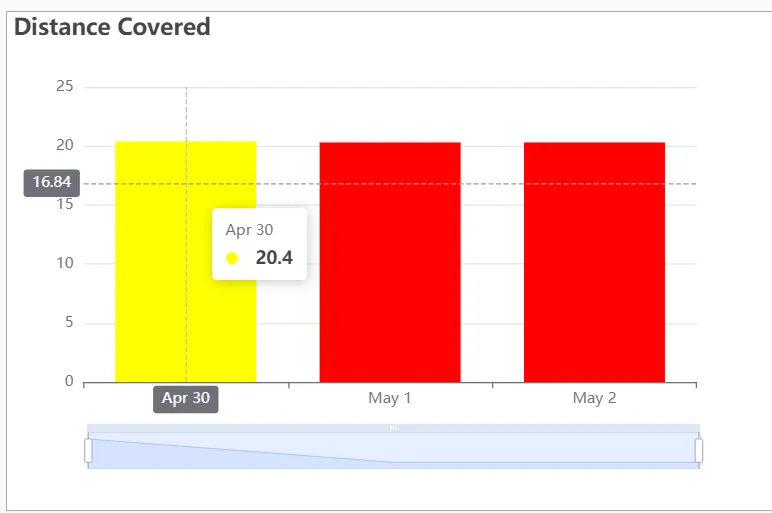
你可能有一个与每天所需颜色对应的数组。

最开始可能是空的,然后根据当天情况将相关颜色推入其中!

  var cars1 = data.data_1;

  var color_bar = [];

  var text = "";
  var i;

  for (i = 0; i < cars1.length; i++)
    {
    if (cars1[i] < 20.35) {
        color_bar.push("red");
          }  
        else {
      color_bar.push("yellow");
    }

  }

然后你调用每个数据系列的相关颜色...

yAxis: {
              type: 'value'
          },
          series: [{
              data: 
              [
            {
                value: data.data_1[0],
                itemStyle: {color: color_bar[0]},
            },{
                value: data.data_1[1],
                itemStyle: {color: color_bar[1]},
            },{
                value: data.data_1[2],
                itemStyle: {color: color_bar[2]},
            }],

在这里,我基于数值编写了一个示例,但是针对“日期”的条件也可以。

希望这可以帮助你伙计。

enter image description here


0
您不需要为每个获取到的数据设置颜色,只需将此 props 传递给 series,echart 将提供随机不同的颜色。
 series: [
        {
            data: [120,200,350,70,18,150],
            colorBy: "data",
            type: 'bar',
            barWidth: "50%",
    ], 

只需添加这个:

colorBy :'data'

快乐编码!


网页内容由stack overflow 提供, 点击上面的
可以查看英文原文,
原文链接