我想找到并绘制一个函数f,该函数表示已知一些集合点x和y上拟合的曲线。经过一些研究,我开始尝试使用scipy.optimize和curve_fit进行实验,但在参考指南中我发现该程序使用一个函数来适应数据,并且假设ydata = f(xdata,* params)+ eps。
所以我的问题是:我需要在代码中更改什么才能使用curve_fit或任何其他库来查找使用我的设置点的曲线函数?(注意:我也想知道该函数,以便稍后在我的项目中进行积分和绘制)。我知道它将是一个衰减指数函数,但不知道确切的参数。这是我在程序中尝试的内容:
所以我的问题是:我需要在代码中更改什么才能使用curve_fit或任何其他库来查找使用我的设置点的曲线函数?(注意:我也想知道该函数,以便稍后在我的项目中进行积分和绘制)。我知道它将是一个衰减指数函数,但不知道确切的参数。这是我在程序中尝试的内容:
import numpy as np
import matplotlib.pyplot as plt
from scipy.optimize import curve_fit
def func(x, a, b, c):
return a * np.exp(-b * x) + c
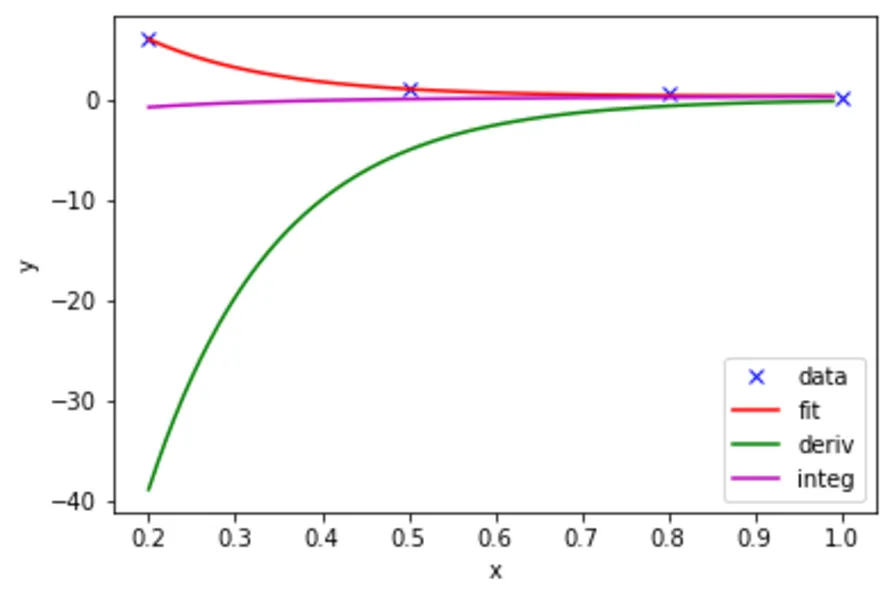
xdata = np.array([0.2, 0.5, 0.8, 1])
ydata = np.array([6, 1, 0.5, 0.2])
plt.plot(xdata, ydata, 'b-', label='data')
popt, pcov = curve_fit(func, xdata, ydata)
plt.plot(xdata, func(xdata, *popt), 'r-', label='fit')
plt.xlabel('x')
plt.ylabel('y')
plt.legend()
plt.show()
目前正在树莓派上开发此项目,如果有变化,请告知。我希望使用最小二乘法,因为它很好并且精确,但是欢迎任何其他有效的方法。
同样,这是基于scipy库的参考指南。 我得到了以下图形,这甚至不是一条曲线:基于设定点的图形和曲线
![[1]](https://istack.dev59.com/ZDmzz.webp)