我有一个数据框 dt,其中包含有关潜水行为的数据,分别在三个不同的区域 BA, MI, FA。
我想使用 ggarrange 在我的多个图表(ba, mi, fa)上添加主标题,但我没有找到有效的方法。
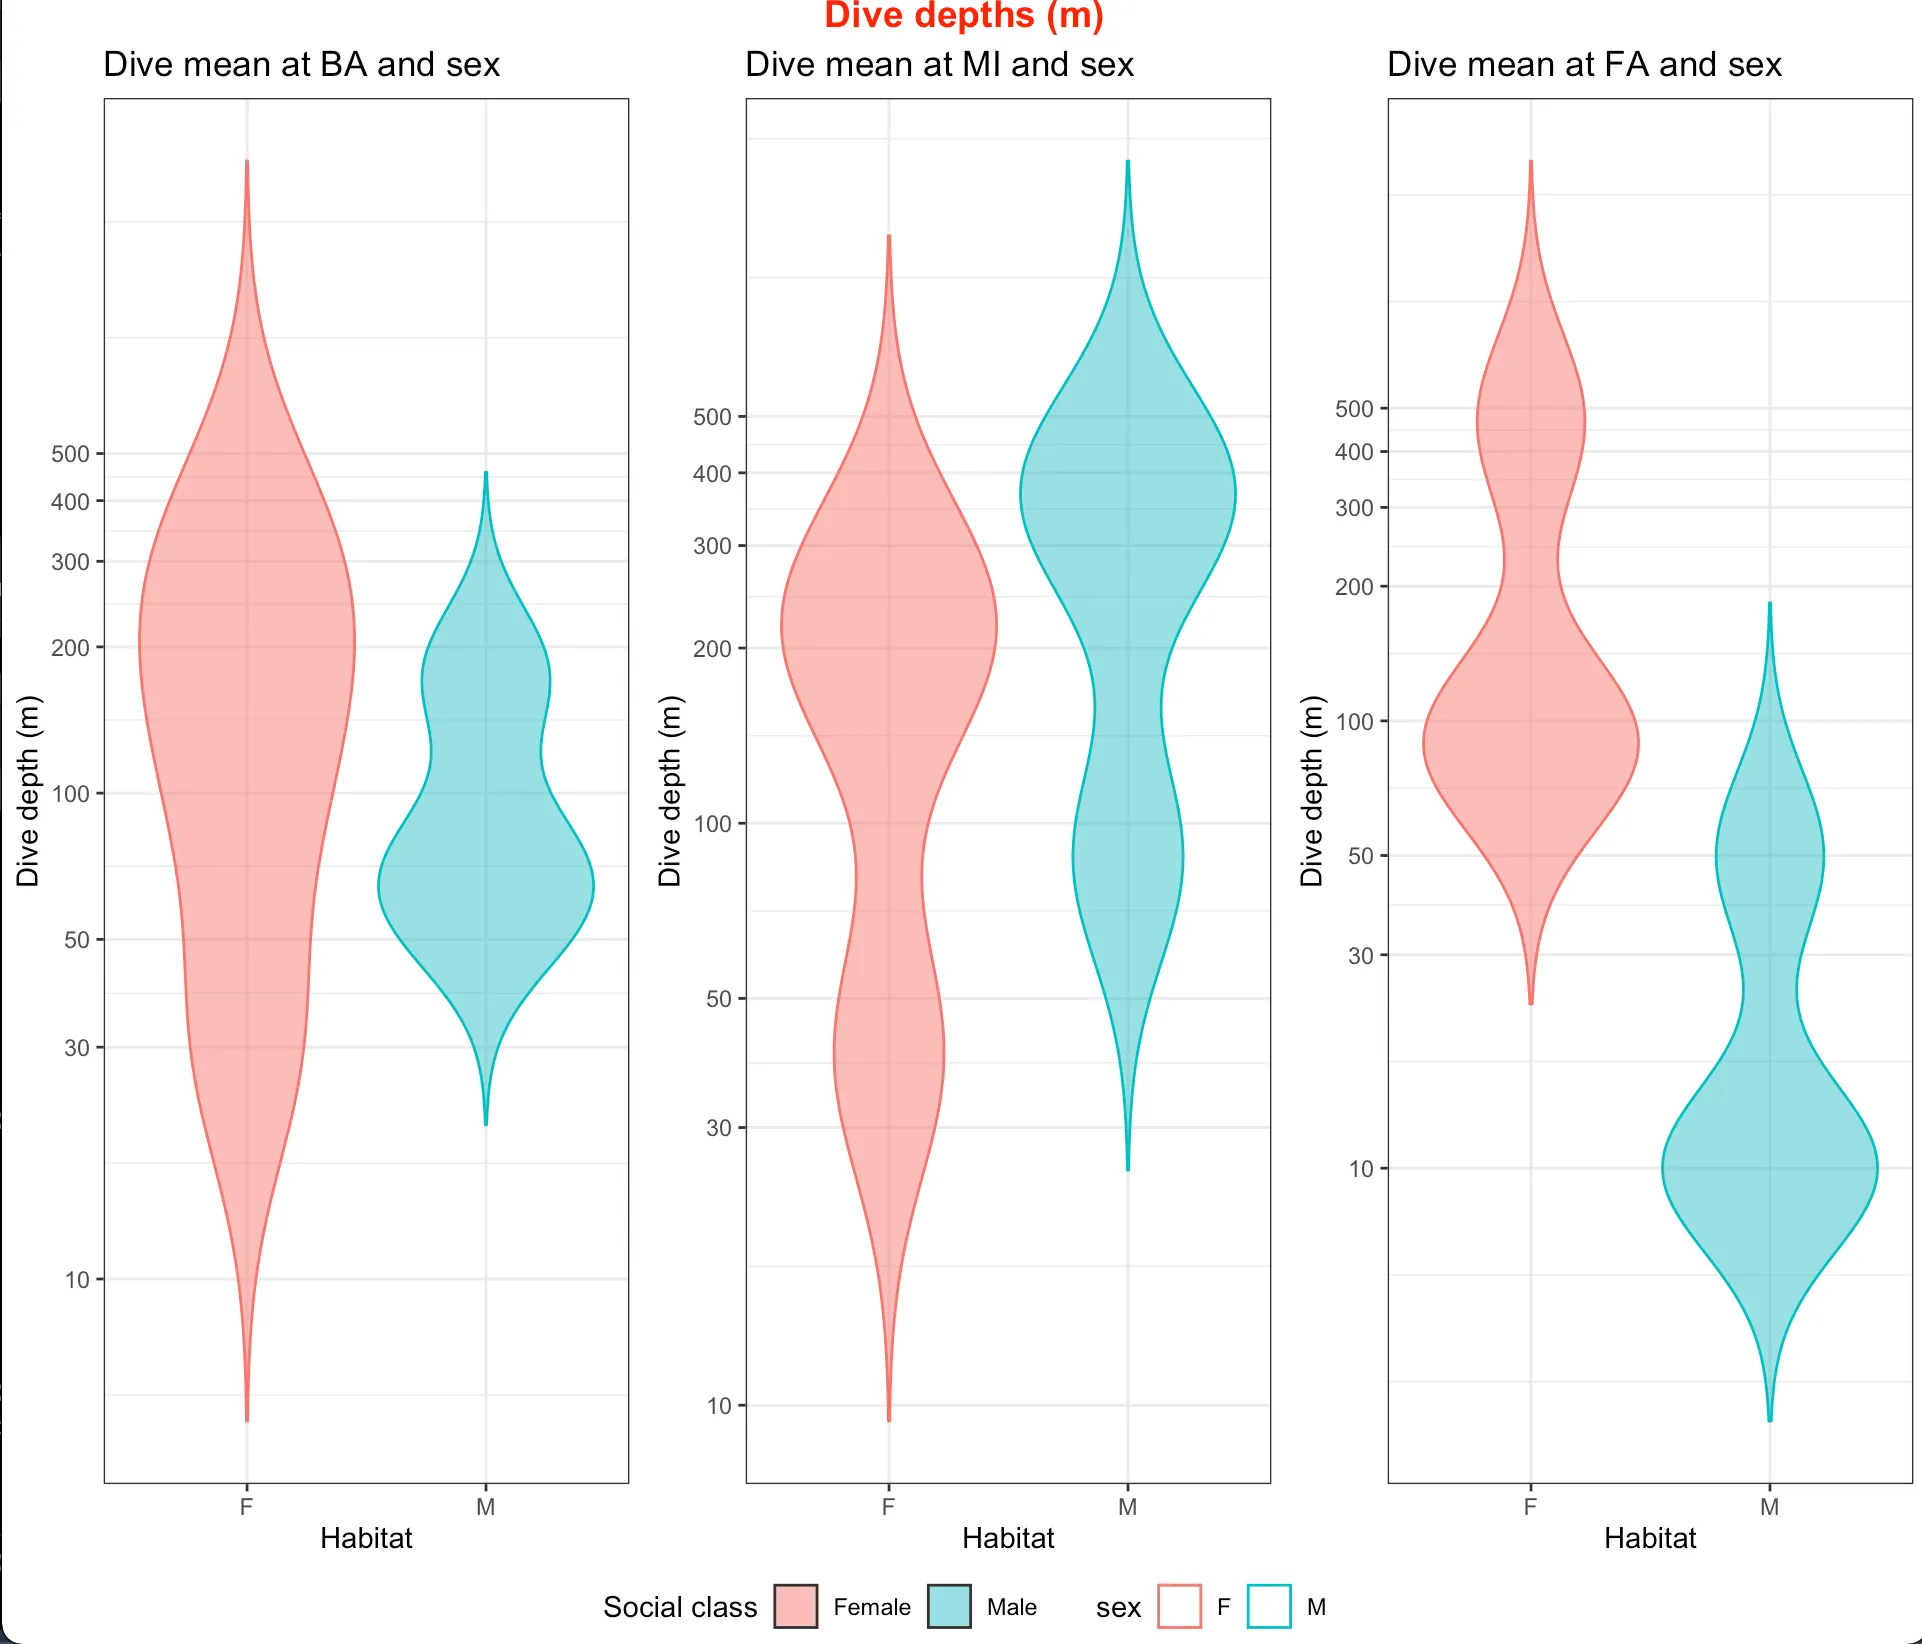
我想在我的 3 个图表顶部添加主标题 "潜水深度 (m)"。
library(data.table)
library(ggplot2)

dt = data.table(area= c("BA", "FA", "MI"),
                dmean = c(30, 50, 200, 76, 467, 87, 98, 10, 240, 176, 89, 400, 340, 10, 40, 54, 89, 340, 205),
                sex = c("F", "M"))

ba<-ggplot(dt[dt$area=="BA",], mapping = aes(y = dmean, x = sex, color = sex, fill=sex))+
  geom_violin(alpha=.5,scale = "width",trim = FALSE, position=position_dodge(1))+
  ggtitle("Dive mean at BA and sex")+
  scale_y_log10(breaks = c(10, 30, 50, 100, 200, 300, 400, 500)) +
  scale_fill_discrete(name="Social class",
                      labels=c("Female", "Male"))+
  xlab("Habitat")+
  ylab("Dive depth (m)")+
  theme_bw();ba

mi<-ggplot(dt[dt$area=="MI",], mapping = aes(y = dmean, x = sex, color = sex, fill=sex))+
  geom_violin(alpha=.5,scale = "width",trim = FALSE, position=position_dodge(1))+
  ggtitle("Dive mean at MI and sex")+
  scale_y_log10(breaks = c(10, 30, 50, 100, 200, 300, 400, 500)) +
  scale_fill_discrete(name="Social class",
                      labels=c("Female", "Male"))+
  xlab("Habitat")+
  ylab("Dive depth (m)")+
  theme_bw();mi

fa<-ggplot(dt[dt$area=="FA",], mapping = aes(y = dmean, x = sex, color = sex, fill=sex))+
  geom_violin(alpha=.5,scale = "width",trim = FALSE, position=position_dodge(1))+
  ggtitle("Dive mean at FA and sex")+
  scale_y_log10(breaks = c(10, 30, 50, 100, 200, 300, 400, 500)) +
  scale_fill_discrete(name="Social class",
                      labels=c("Female", "Male"))+
  xlab("Habitat")+
  ylab("Dive depth (m)")+
  theme_bw();fa

t<-ggarrange(ba, mi, fa,
             ncol=3, nrow=1, common.legend = TRUE, legend="bottom");t

#I tried insert:
 ggtitle = "Dive depths (m)"
 top = "Dive depths (m)")
 top=textGrob("Dive depths (m)"
有人知道该怎么做吗?