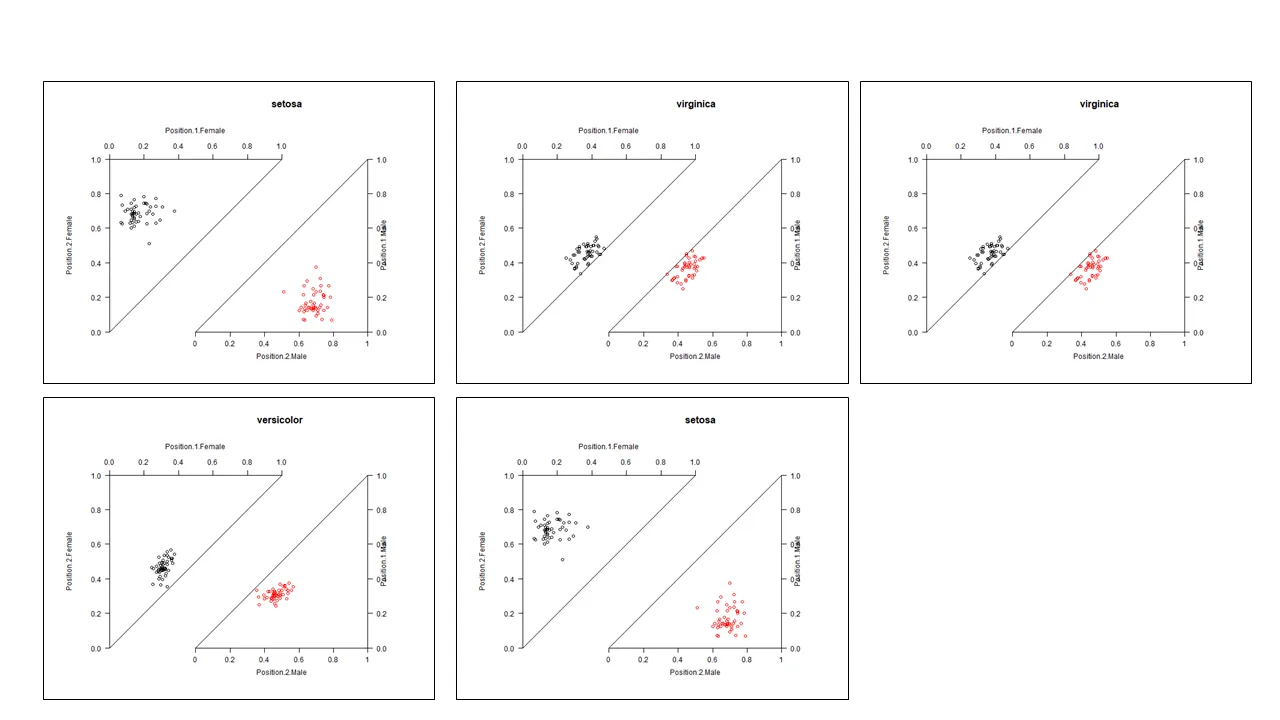
我正在使用RStudio并尝试使用下面的功能构建一个3x3网格的三角形图。我已经包含了一个可重现的示例,但我遇到的问题是边距太大以至于无法绘制多个图形,即使我缩小了宽度和高度。 我还尝试将它们保存为png格式并加载进来,然后使用cowplot进行排列,但结果非常模糊,我不知道如何调整文本大小或线条粗细以使图形更易读。
 #Data
iris$nrm.Sepal <- iris$Sepal.Width / iris$Sepal.Length
iris$nrm.Petal <- iris$Petal.Width / iris$Petal.Length
df_list <- split(iris, (iris$Species))

top.triangle <- function() {
  plot(my.y ~ my.x, data= my.data, axes=FALSE, ylab='', xlab="",
       main='', xlim=c(0, 1), ylim=c(0, 1), xaxt="n", yaxt="n", asp=1)
  mtext("Here could be your title", 3, 5, font=2, cex=1.3, adj=.95)
  mtext("Position.2", 2, .75)
  mtext("Position.1", 3, 2)
  axis(side=2, las=1, pos=0)
  axis(side=3, las=1, pos=1)
  lines(0:1, 0:1)
}

bottom.triangle <- function() {
  points(my.x ~ my.y, data=my.data.2, xpd=TRUE)
  mtext("Position.2", 1, 1.5, at=mean(par()$usr[1:2]) + x.dist)
  mtext("Position.1", 4, 3, padj=par()$usr[1] + 10)
  x.at <- axisTicks(par()$usr[1:2], 0) + x.dist
  axis(side=1, las=1, pos=0, at=x.at,
       labels=F, xpd=TRUE)
  mtext(seq(0, 1, .2), 1, 0, at=x.at)
  axis(4, las=1, pos=1 + x.dist)
  lines(0:1 + x.dist, 0:1, xpd=TRUE)
}

#loop for generating species specific plots
for(i in 1:(length(df_list))){
  current.strain <- as.character(df_list[[i]]$Species[1])

  #declare file for saving png
  # png(paste0("~.test.triangle_", current.strain, ".png"),  width=650, height=500)
  plot.new()
  my.data = iris
  my.x.top = (iris %>% filter(Species == current.strain) )$nrm.Petal
  my.y.top = (iris %>% filter(Species == current.strain) )$nrm.Sepal
  my.x.bottom = (iris %>% filter(Species == current.strain) )$nrm.Petal
  my.y.bottom = (iris %>% filter(Species == current.strain) )$nrm.Sepal

  op <- par(mar=c(3, 2, 2, 2) + 0.1, oma=c(2, 0, 0, 2))
  top.triangle(my.y.top, my.x.top, my.data)

  bottom.triangle(my.y.bottom+x.dist, my.x.bottom, my.data)

  par(op)
  RP[[i]] <- recordPlot()
  dev.off()
}

#for margins too large error
graphics.off()
par("mar")
par(mar=c(.1,.1,.1,.1))

#draw and arrange the plots
ggdraw() +
  draw_plot(RP[[1]], x=0, y=0)

#Add remaining plots
#draw_plot(RP[[2]], x=.25, y=.25)
#draw_plot(RP[[3]], x=.25, y=.25)
(这是基于我在此问题中发布的答案构建的,R基础绘图,组合镜像右三角形)
par(mfrow=c(3,3))来创建一个 3x3 的图形网格。 - DanYtop.triangle != top.triangle2和bottom.triangle != bottom.triangle2,而且仅更改名称是不够的,因为使用了位置参数。请在空的 R 环境中测试代码,并使用library()调用指定所有非基本包。 - Parfait