另一个解决方案是使用优秀的tikzDevice
从rmarkdown 文档中,我们可以包含一个设备设置为tikz的knitr 代码块。
example.Rmd
---
output:
pdf_ document:
latex_ engine: xelatex
header-includes:
- \renewcommand {\familydefault }{\sfdefault }
- \usepackage {tikz}
---
```{r setup, include=FALSE}
library(tikzDevice)
# setting the package options so that the font metrics are calculated correctly
options(
tikzLatexPackages = c(
getOption("tikzLatexPackages"),
"\\ renewcommand{\\ familydefault}{\\ sfdefault}"
)
)
```
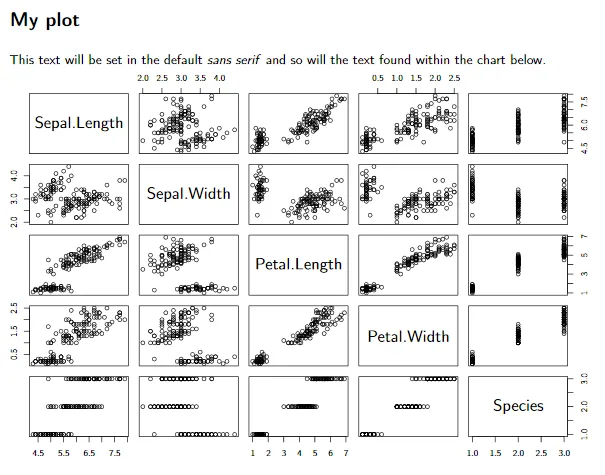
# My plot
This text will be set in the default *sans serif* and so will the text found
within the chart below.
```{r, echo=FALSE, dev='tikz'}
pairs(iris)
```
你可以用任何LaTeX命令替换我的
\renewcommand{\familydefault}{\sfdefault}以设置所选字体,例如
\usepackage{charter}。请注意,必须像上面的示例中一样转义
\。
example.pdf
备选方案
如果你有许多图表需要生成,你可能希望提前使用另一个脚本生成所有的图表,而不是在文档生成时内联地进行编织 。我会为大量报告(1000+)每个报告都包含约20个图表这样做。
# a more simple example due to output size
library(tikzDevice)
mpg <- mtcars$mpg

tikz(file = "example.tex"); hist(mpg); dev.off()
example.tex
% !TEX encoding = UTF-8 Unicode
\begin {tikzpicture}[x=1pt,y=1pt]
\definecolor {fillColor}{RGB}{255,255,255}
\path [use as bounding box,fill=fillColor,fill opacity=0.00] (0,0) rectangle (216.81,216.81);
\begin {scope}
\path [clip] ( 0.00, 0.00) rectangle (216.81,216.81);
\definecolor {drawColor}{RGB}{0,0,0}
\node [text=drawColor,anchor=base,inner sep=0pt, outer sep=0pt, scale= 1.20] at (120.41,188.07) {\bfseries Histogram of mpg};
\node [text=drawColor,anchor=base,inner sep=0pt, outer sep=0pt, scale= 1.00] at (120.41, 15.60) {mpg};
\node [text=drawColor,rotate= 90.00,anchor=base,inner sep=0pt, outer sep=0pt, scale= 1.00] at ( 10.80,114.41) {Frequency};
\end {scope}
\begin {scope}
\path [clip] ( 0.00, 0.00) rectangle (216.81,216.81);
\definecolor {drawColor}{RGB}{0,0,0}
\path [draw=drawColor,line width= 0.4pt,line join=round,line cap=round] ( 54.47, 61.20) -- (186.34, 61.20);
\path [draw=drawColor,line width= 0.4pt,line join=round,line cap=round] ( 54.47, 61.20) -- ( 54.47, 55.20);
\path [draw=drawColor,line width= 0.4pt,line join=round,line cap=round] ( 80.85, 61.20) -- ( 80.85, 55.20);
\path [draw=drawColor,line width= 0.4pt,line join=round,line cap=round] (107.22, 61.20) -- (107.22, 55.20);
\path [draw=drawColor,line width= 0.4pt,line join=round,line cap=round] (133.59, 61.20) -- (133.59, 55.20);
\path [draw=drawColor,line width= 0.4pt,line join=round,line cap=round] (159.96, 61.20) -- (159.96, 55.20);
\path [draw=drawColor,line width= 0.4pt,line join=round,line cap=round] (186.34, 61.20) -- (186.34, 55.20);
\node [text=drawColor,anchor=base,inner sep=0pt, outer sep=0pt, scale= 1.00] at ( 54.47, 39.60) {10};
\node [text=drawColor,anchor=base,inner sep=0pt, outer sep=0pt, scale= 1.00] at ( 80.85, 39.60) {15};
\node [text=drawColor,anchor=base,inner sep=0pt, outer sep=0pt, scale= 1.00] at (107.22, 39.60) {20};
\node [text=drawColor,anchor=base,inner sep=0pt, outer sep=0pt, scale= 1.00] at (133.59, 39.60) {25};
\node [text=drawColor,anchor=base,inner sep=0pt, outer sep=0pt, scale= 1.00] at (159.96, 39.60) {30};
\node [text=drawColor,anchor=base,inner sep=0pt, outer sep=0pt, scale= 1.00] at (186.34, 39.60) {35};
\path [draw=drawColor,line width= 0.4pt,line join=round,line cap=round] ( 49.20, 65.14) -- ( 49.20,163.67);
\path [draw=drawColor,line width= 0.4pt,line join=round,line cap=round] ( 49.20, 65.14) -- ( 43.20, 65.14);
\path [draw=drawColor,line width= 0.4pt,line join=round,line cap=round] ( 49.20, 81.56) -- ( 43.20, 81.56);
\path [draw=drawColor,line width= 0.4pt,line join=round,line cap=round] ( 49.20, 97.98) -- ( 43.20, 97.98);
\path [draw=drawColor,line width= 0.4pt,line join=round,line cap=round] ( 49.20,114.40) -- ( 43.20,114.40);
\path [draw=drawColor,line width= 0.4pt,line join=round,line cap=round] ( 49.20,130.83) -- ( 43.20,130.83);
\path [draw=drawColor,line width= 0.4pt,line join=round,line cap=round] ( 49.20,147.25) -- ( 43.20,147.25);
\path [draw=drawColor,line width= 0.4pt,line join=round,line cap=round] ( 49.20,163.67) -- ( 43.20,163.67);
\node [text=drawColor,rotate= 90.00,anchor=base,inner sep=0pt, outer sep=0pt, scale= 1.00] at ( 34.80, 65.14) {0};
\node [text=drawColor,rotate= 90.00,anchor=base,inner sep=0pt, outer sep=0pt, scale= 1.00] at ( 34.80, 81.56) {2};
\node [text=drawColor,rotate= 90.00,anchor=base,inner sep=0pt, outer sep=0pt, scale= 1.00] at ( 34.80, 97.98) {4};
\node [text=drawColor,rotate= 90.00,anchor=base,inner sep=0pt, outer sep=0pt, scale= 1.00] at ( 34.80,114.40) {6};
\node [text=drawColor,rotate= 90.00,anchor=base,inner sep=0pt, outer sep=0pt, scale= 1.00] at ( 34.80,130.83) {8};
\node [text=drawColor,rotate= 90.00,anchor=base,inner sep=0pt, outer sep=0pt, scale= 1.00] at ( 34.80,147.25) {10};
\end {scope}
\begin {scope}
\path [clip] ( 49.20, 61.20) rectangle (191.61,167.61);
\definecolor {drawColor}{RGB}{0,0,0}
\path [draw=drawColor,line width= 0.4pt,line join=round,line cap=round] ( 54.47, 65.14) rectangle ( 80.85,114.40);
\path [draw=drawColor,line width= 0.4pt,line join=round,line cap=round] ( 80.85, 65.14) rectangle (107.22,163.67);
\path [draw=drawColor,line width= 0.4pt,line join=round,line cap=round] (107.22, 65.14) rectangle (133.59,130.83);
\path [draw=drawColor,line width= 0.4pt,line join=round,line cap=round] (133.59, 65.14) rectangle (159.96, 81.56);
\path [draw=drawColor,line width= 0.4pt,line join=round,line cap=round] (159.96, 65.14) rectangle (186.34, 97.98);
\end {scope}
\end {tikzpicture}
注意:这不是一个完整的.tex文件,而是设计用于使用
或嵌入到完整文档中。此外,请注意字体度量计算,如果度量显着偏差,则保存的.tex文件可能会在不同字体下呈现奇怪的效果。
pdftk,然后使用类似于pdftk *.pdf cat output mergedfile.pdf这样的命令。我猜你可以在合并后的pdf上应用“嵌入字体”的操作。 - DJacktex文件,其中包含许多\includegraphics[width=\textwidth]{pdfs/graph_made_with_R_12345.pdf}。 - Eugeny89