我正在调用ggplot函数。
ggplot(data,aes(x,y,fill=category)+geom_bar(stat="identity")
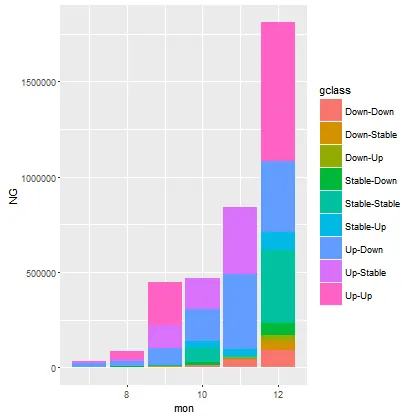
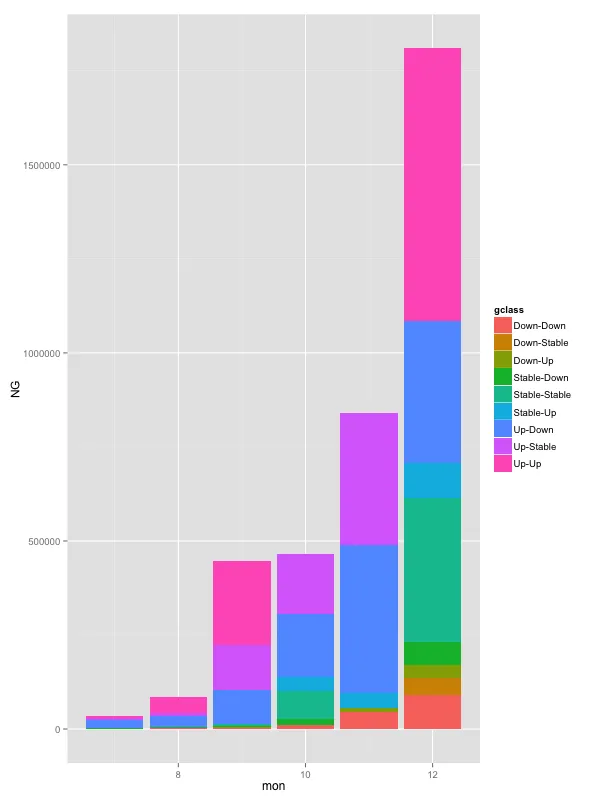
结果是一张柱状图,柱子的颜色对应着各自的类别。然而,颜色的顺序在不同的柱子中并不一致。比如有粉色、绿色和蓝色。有些柱子从下往上是粉色、绿色、蓝色,有些则是绿色、粉色、蓝色。我没有看到任何明显的模式。
这些顺序是怎么选出来的呢?我该如何改变它?至少我该如何让ggplot选择一个一致的顺序呢?
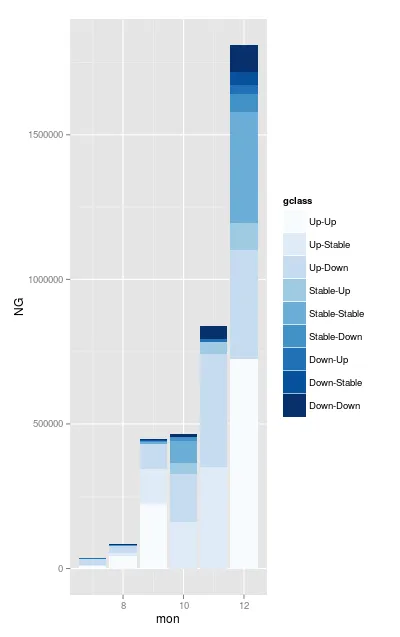
(x、y 和 category)的类别分别是 (整数、数值和因子)。如果我将 category 设为有序因子,也无法改变这种行为。
有人知道如何解决这个问题吗?
可重现的例子:
data <- data.frame(
  mon = c(
    9L, 10L, 11L, 10L, 8L, 7L, 7L, 11L, 9L, 10L, 12L, 11L, 7L,
    12L, 8L, 12L, 9L, 7L, 9L, 10L, 10L, 8L, 12L, 7L, 11L, 10L, 8L,
    7L, 11L, 12L, 12L, 9L, 9L, 7L, 7L, 12L, 12L, 9L, 9L, 8L
  ),
  gclass = ordered(c(
    "Up-Up", "Down-Down", "Up-Stable", "Stable-Up", "Stable-Down",
    "Stable-Down", "Down-Up", "Stable-Up", "Down-Stable", "Stable-Down",
    "Down-Down", "Down-Down", "Stable-Stable", "Up-Down", "Down-Down",
    "Stable-Up", "Up-Stable", "Stable-Up", "Stable-Down", "Up-Down",
    "Up-Stable", "Up-Down", "Up-Up", "Up-Stable", "Down-Up", "Stable-Stable",
    "Up-Up", "Down-Stable", "Up-Down", "Down-Up", "Stable-Stable",
    "Stable-Stable", "Up-Down", "Up-Down", "Up-Up", "Down-Stable",
    "Stable-Down", "Down-Down", "Down-Up", "Up-Stable"
  )),
  NG = c(
    222614.67, 9998.17, 351162.2, 37357.95, 4140.48, 1878.57, 553.86, 40012.25,
    766.52, 15733.36, 90676.2, 45000.29, 0, 375699.84, 2424.21, 93094.21,
    120547.69, 291.33, 1536.38, 167352.21, 160347.01, 26851.47, 725689.06,
    4500.55, 10644.54, 75132.98, 42676.41, 267.65, 392277.64, 33854.26, 384754.67,
    7195.93, 88974.2, 20665.79, 7185.69, 45059.64, 60576.96, 3564.53, 1262.39,
    9394.15
  )
)

ggplot(data, aes(mon, NG, fill = gclass)) + geom_bar(stat = "identity")