我试图找出按年份排名前五种最丰富物种的平均CPUE的最佳绘图方法。我能够将它们全部分开绘制,但这需要大量代码并且会变得混乱,我无法想出如何将它们全部绘制在同一张图中。
这是我的数据子集
structure(list(year = c(2011, 2016, 2016, 2009, 2016, 2016, 2011,
                               2009, 2014, 2008, 2011, 2016, 2012, 2017, 2008, 2009, 2018, 2018,
                               2016, 2012, 2013, 2012, 2016, 2013, 2017, 2012, 2016, 2009, 2008,
                               2011, 2010, 2014, 2015, 2015, 2017, 2015, 2013, 2014, 2008, 2013,
                               2018, 2013, 2013, 2009, 2009, 2010, 2017, 2010, 2008, 2013, 2013,
                               2018, 2011, 2015, 2009, 2010, 2013, 2008, 2008, 2010, 2008, 2010,
                               2011, 2015, 2008, 2012, 2016, 2016, 2008, 2018, 2012, 2013, 2012,
                               2016, 2016, 2014, 2010, 2012, 2011, 2013, 2015, 2015, 2009, 2010,
                               2009, 2008, 2016, 2017, 2008, 2012, 2015, 2008, 2016, 2017, 2014,
                               2009, 2009, 2011, 2012, 2012), Commonname = c("Grass Porgy",
                                                                             "Sand Perch", "Lane Snapper", "Scallops", "Striped Burrfish",
                                                                             "Dusky Pipefish", "Eucinostomus", "Scallops", "Dusky Pipefish",
                                                                             "Gulf Toadfish", "White Grunt", "Black Sea Bass", "Silver Perch",
                                                                             "Eucinostomus", "Pigfish", "Banded Blenny", "Black Sea Bass",
                                                                             "Spotted Seatrout", "Bay Scallop", "Fringed Filefish", "Planehead Filefish",
                                                                             "Pigfish", "Grass Porgy", "Bighead Searobin", "Lane Snapper",
                                                                             "Scallops", "Southern Puffer", "Dusky Pipefish", "Pigfish", "Pinfish",
                                                                             "Pink Shrimp", "Spotted Seatrout", "Pink Shrimp", "Inshore Lizardfish",
                                                                             "Bay Scallop", "Lined Sole", "White Grunt", "Spotted Seatrout",
                                                                             "Gulf Toadfish", "Lined Sole", "Pinfish", "Gulf Toadfish", "Pinfish",
                                                                             "Pigfish", "Fringed Filefish", "Fringed Filefish", "Atlantic Calico Scallop",
                                                                             "Eucinostomus", "Pinfish", "Pink Shrimp", "Inshore Lizardfish",
                                                                             "Portunus Crabs", "Scallops", "Dusky Pipefish", "Fringed Filefish",
                                                                             "Pigfish", "Planehead Filefish", "Pigfish", "Silver Perch", "Fringed Pipefish",
                                                                             "Spottail Pinfish", "Scrawled Cowfish", "Ocellated Moray", "Spottail Pinfish",
                                                                             "Planehead Filefish", "White Grunt", "Spottail Pinfish", "Banded Blenny",
                                                                             "Pink Shrimp", "Pigfish", "Hogfish", "Fringed Pipefish", "Grass Porgy",
                                                                             "Gulf Pipefish", "Bay Scallop", "Orange Filefish", "Scallops",
                                                                             "Polka-dot Batfish", "Gulf Toadfish", "Scallops", "Gulf Toadfish",
                                                                             "Pigfish", "Silver Perch", "White Grunt", "Spottail Pinfish",
                                                                             "Striped Burrfish", "Bandtail Puffer", "Scrawled Cowfish", "Chain Pipefish",
                                                                             "Portunus Crabs", "Gulf Toadfish", "Scallops", "Dusky Pipefish",
                                                                             "Spottail Pinfish", "Inshore Lizardfish", "Striped Burrfish",
                                                                             "Inshore Lizardfish", "Spottail Pinfish", "Planehead Filefish",
                                                                             "Banded Blenny"), CPUE = c(0.134916351861846, 0.149907057624273,
                                                                                                        0.134916351861846, 0.404749055585537, 0.134916351861846, 1.19925646099418,
                                                                                                        0.134916351861846, 0.134916351861846, 0.539665407447383, 0.224860586436409,
                                                                                                        0.404749055585537, 2.02374527792769, 1.34916351861846, 0.94441446303292,
                                                                                                        0.224860586436409, 0.299814115248546, 0.149907057624273, 0.404749055585537,
                                                                                                        0.149907057624273, 1.18051807879115, 2.02374527792768, 3.77765785213168,
                                                                                                        0.963688227584612, 0.168645439827307, 0.337290879654614, 0.674581759309228,
                                                                                                        0.168645439827307, 2.39851292198837, 0.674581759309228, 12.2923787251904,
                                                                                                        0.168645439827307, 0.299814115248546, 0.269832703723691, 0.134916351861846,
                                                                                                        2.02374527792768, 0.134916351861846, 0.134916351861846, 0.134916351861846,
                                                                                                        0.269832703723691, 0.269832703723691, 1.51780895844576, 0.809498111171074,
                                                                                                        1.07933081489477, 0.134916351861846, 0.134916351861846, 0.134916351861846,
                                                                                                        0.134916351861846, 0.134916351861846, 0.674581759309228, 0.269832703723691,
                                                                                                        0.149907057624273, 0.149907057624273, 0.224860586436409, 1.648977633867,
                                                                                                        0.599628230497092, 1.4840798704803, 0.192737645516922, 0.674581759309228,
                                                                                                        0.269832703723691, 1.04934940336991, 2.02374527792769, 0.149907057624273,
                                                                                                        0.134916351861846, 0.134916351861846, 5.26173772261198, 0.404749055585537,
                                                                                                        4.34730467110392, 0.674581759309228, 0.134916351861846, 0.599628230497092,
                                                                                                        1.07933081489477, 0.245302457930628, 0.269832703723691, 0.134916351861846,
                                                                                                        0.449721172872819, 0.134916351861846, 0.269832703723691, 0.134916351861846,
                                                                                                        1.79888469149128, 0.674581759309228, 0.134916351861846, 1.34916351861846,
                                                                                                        0.269832703723691, 1.34916351861846, 0.134916351861846, 0.134916351861846,
                                                                                                        0.149907057624273, 0.134916351861846, 0.404749055585537, 0.134916351861846,
                                                                                                        1.4840798704803, 1.34916351861846, 2.24860586436409, 0.168645439827307,
                                                                                                        0.269832703723691, 0.149907057624273, 0.134916351861846, 4.04749055585537,
                                                                                                        0.149907057624273, 0.674581759309228)), row.names = c(1:200), class = "data.frame")
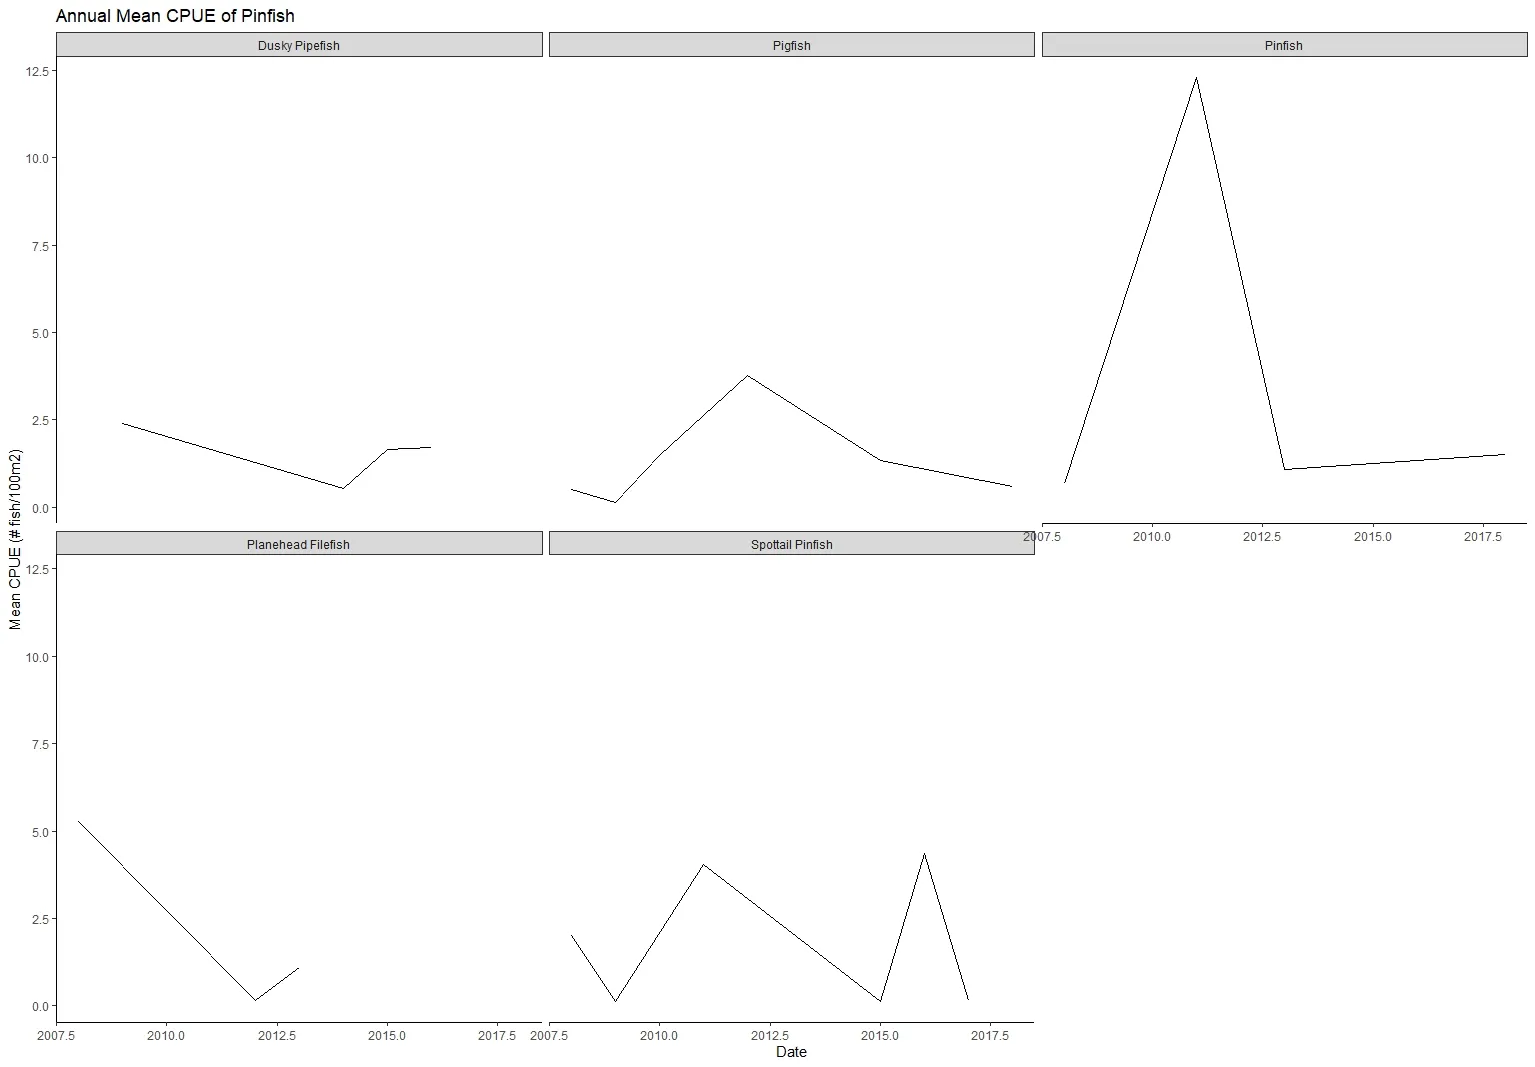
我在整个数据集上使用了这段代码,提取了每个物种的平均CPUE值,然后使用ggplot得到了下面的图形。
pinfish <- df %>%
  filter( Commonname == "Pinfish") %>%
  group_by(year) %>%
  summarise(CPUE = mean(CPUE))
pinfish

ggplot(pinfish, aes(x=year, y= CPUE)) +
  geom_line(aes()) +
  labs(title = "Annual Mean CPUE of Pinfish", y = "Mean CPUE (# fish/100m2)", x = "Date")+
  theme_bw() + theme(panel.border = element_blank(), panel.grid.major = element_blank(),
                     panel.grid.minor = element_blank(), axis.line = element_line(colour = "black"),
                     axis.text.x = element_text(angle = 0))
[![enter image description here][1]][1]
有没有一种方法能够创建一个图表,展示出数据集中前五个最丰富物种的平均CPUE,而不需要像上面手动分离这些物种?这些是否可以合并到一个具有多条线的图表中或分成并排的单独图表呢?
我通过excel过滤数据找到了前五个最丰富的物种,但我很想知道是否有一种在R中快速过滤数据的方法?使用此数据子集可能无法获得相同的结果,但如果您能提供代码来提取它,那将是非常好的。
我在excel中检测到的前5个物种是: pinfish, pigfish, spottail pinfish, black sea bass和dusky pipefish。
非常感谢您提供的任何帮助!