我正在使用matplotlib.pyplot比较一些算法结果,但由于几条线具有完全相同的颜色,所以很难理解发生了什么。有没有办法避免这种情况?我不认为pyplot只有七种颜色,是吗?
如何避免在matplotlib.pyplot中重复使用线条颜色?
9
- tunnuz
2
http://matplotlib.sourceforge.net/users/pyplot_tutorial.html - Ion
我建议您查看这篇文章:https://dev59.com/p2445IYBdhLWcg3wiq8i - user3136560
4个回答
13
对于Python 3,你可以使用上面的解决方案:
colormap = plt.cm.nipy_spectral
colors = colormap(np.linspace(0, 1, number_of_plots))
ax.set_prop_cycle('color', colors)
import seaborn as sns
colors = sns.color_palette('hls', number_of_plots)
ax.set_prop_cycle('color', colors)
- Ulysses
12
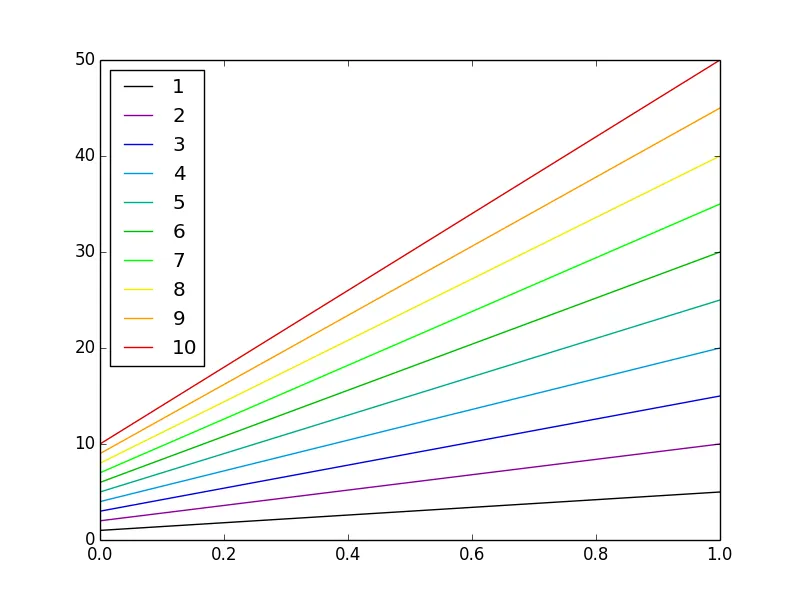
如果您知道需要绘制多少个图,最好在之前定义好颜色映射:
import matplotlib.pyplot as plt
import numpy as np

fig1 = plt.figure()
ax1 = fig1.add_subplot(111)
number_of_plots=10
colormap = plt.cm.nipy_spectral #I suggest to use nipy_spectral, Set1,Paired
ax1.set_color_cycle([colormap(i) for i in np.linspace(0, 1,number_of_plots)])
for i in range(1,number_of_plots+1):
    ax1.plot(np.array([1,5])*i,label=i)

ax1.legend(loc=2)
使用 nipy_spectral
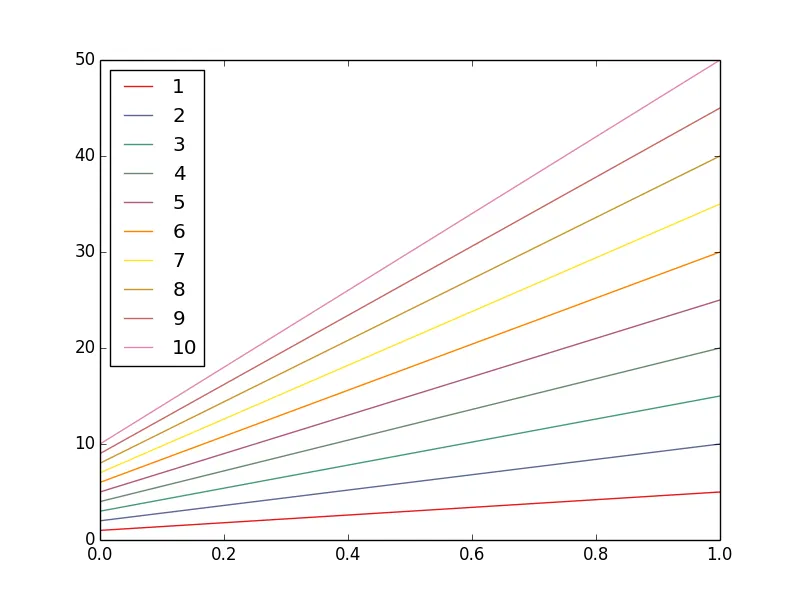
使用 Set1
- G M
1
1我们应该担心
set_color_cycle()在1.5版本中已被弃用吗? plt建议使用set_prop_cycle()代替(但我还没有尝试过)。 - dwanderson6
我建议使用Seaborn库。使用这个库,您可以很容易地生成所需数量的顺序或质量颜色调色板。还有一个工具可以可视化调色板。例如:
import seaborn as sns

colors = sns.color_palette("hls", 4)
sns.palplot(colors)
plt.savefig("pal1.png")
colors = sns.color_palette("hls", 8)
sns.palplot(colors)
plt.savefig("pal2.png")
colors = sns.color_palette("Set2", 8)
sns.palplot(colors)
plt.savefig("pal3.png")
以下是生成的调色板:


- Ramon Crehuet
5
Matplotlib有超过七种颜色。你可以用多种方式指定你想要的颜色(参见http://matplotlib.sourceforge.net/api/colors_api.html)。
例如,你可以使用html十六进制字符串来指定颜色:
pyplot.plot(x, y, color='#112233')
- Abdelraouf Ouadjaout
网页内容由stack overflow 提供, 点击上面的可以查看英文原文,
原文链接
原文链接