我正在一个项目中使用Chart.js (http://www.chartjs.org/)。
有人知道如何在实际画布上绘制新的内容,比如标题或添加自定义图片,为图表添加“边距”吗?
可以。
您可以将ChartJs的onAnimationComplete回调设置为当ChartJs完成自己的绘制和动画时调用您的自定义绘图代码。
在该回调中,您可以获取画布上下文(==您最初提供给ChartJS的相同画布/上下文),并使用该上下文绘制任何新的自定义内容。
以下是它的工作原理示例:
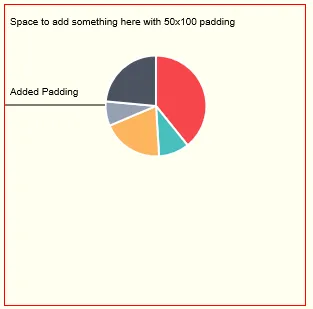
ChartJS没有原生的图表内容"填充"。一个方法是将图表绘制到较小的内存画布上,然后使用偏移量将该内存画布绘制到您的可见画布上,以允许所需的填充。
以下是示例:
var canvas=document.getElementById("canvas");
var ctx=canvas.getContext("2d");
var cw=canvas.width;
var ch=canvas.height;

var pieData = [
  {
    value: 200,
    color:"#F7464A",
    highlight: "#FF5A5E",
    label: "Red"
  },
  {
    value: 50,
    color: "#46BFBD",
    highlight: "#5AD3D1",
    label: "Green"
  },
  {
    value: 100,
    color: "#FDB45C",
    highlight: "#FFC870",
    label: "Yellow"
  },
  {
    value: 40,
    color: "#949FB1",
    highlight: "#A8B3C5",
    label: "Grey"
  },
  {
    value: 120,
    color: "#4D5360",
    highlight: "#616774",
    label: "Dark Grey"
  }

];

// create an in-memory canvas (c)
var c = document.createElement("canvas");

// size it to your desired size (without padding)
c.width=100;
c.height=100;

// make it hidden
c.style.visibility='hidden';
document.body.appendChild(c);

// create the chart on the in-memory canvas
var cctx = c.getContext("2d");
window.myPie = new Chart(cctx).Pie(pieData,{
  responsive:false,
  animation:false,


  // when the chart is fully drawn,
  // draw the in-memory chart to the visible chart
  // allowing for your desired padding
  // (this example pads 100 width and 50 height
  onAnimationComplete:function(){
    ctx.drawImage(c,100,50);
    ctx.fillText('Space to add something here with 50x100 padding',5,20);
    ctx.fillText('Added Padding',5,90);
    ctx.beginPath();
    ctx.moveTo(0,100);
    ctx.lineTo(100,100);
    ctx.stroke();
  }
});body{ background-color: ivory; }
canvas{border:1px solid red;}<script src="https://cdnjs.cloudflare.com/ajax/libs/Chart.js/1.0.2/Chart.min.js"></script>
<canvas id="canvas" width=300 height=300></canvas>