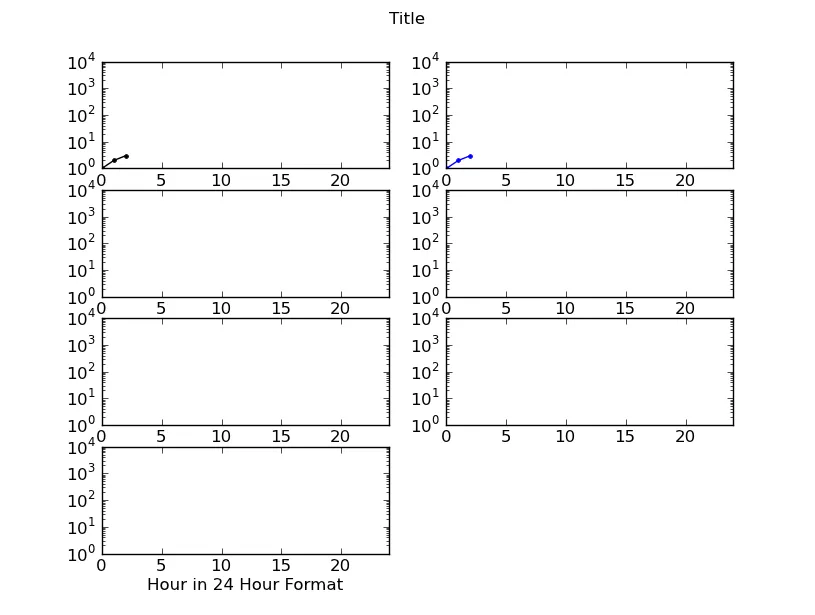
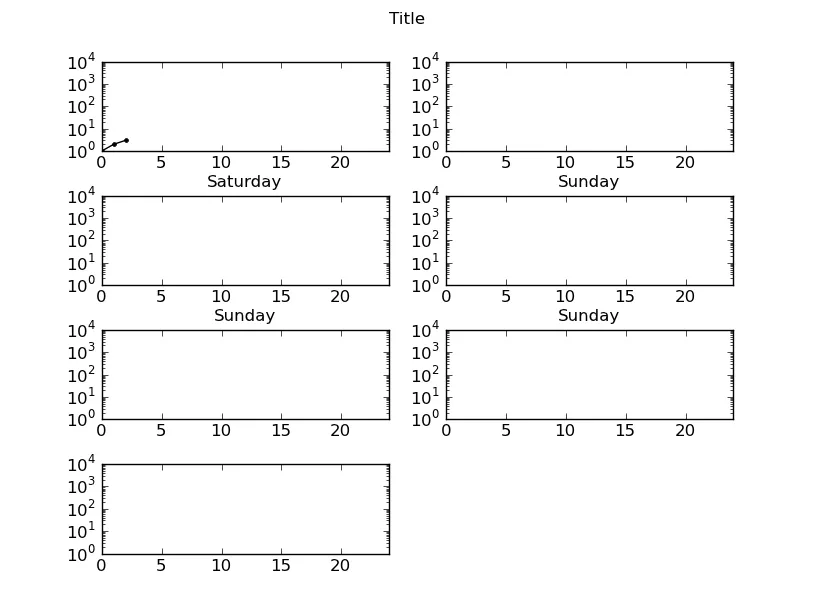
想要在绘制的图形之间添加垂直空间,以便显示X轴标签:
每个图形都需要有空间来显示日期,目前只有最后两个图形显示了日期,因为其他图形覆盖了它。
同时,我也想知道是否可以删除那些被标记为星期四/星期五上面的图形的X轴刻度线,即底部的X轴是唯一显示的。Y轴也是如此,但仅显示左侧的图形尺度。
*很遗憾,由于我的声望不够高,无法发布图片来展示这个问题。
代码片段:
import mathlib.pyplot as pyplot
fig = pyplot.figure()
ax1 = fig.add_subplot(4,2,1)
ax1.set_yscale('log')
ax2 = fig.add_subplot(4,2,2, sharex=ax1, sharey=ax1)
ax3 = fig.add_subplot(4,2,3, sharex=ax2, sharey=ax2)
ax4 = fig.add_subplot(4,2,4, sharex=ax3, sharey=ax3)
ax5 = fig.add_subplot(4,2,5, sharex=ax4, sharey=ax4)
ax6 = fig.add_subplot(4,2,6, sharex=ax5, sharey=ax5)
ax7 = fig.add_subplot(4,2,7, sharex=ax6, sharey=ax6)
ax1.plot(no_dict["Saturday"],'k.-',label='Saturday')
ax1.set_xlabel('Saturday')
ax1.axis([0,24,0,10000])
pyplot.suptitle('Title')
pyplot.xlabel('Hour in 24 Hour Format')
ax2.plot(no_dict["Sunday"],'b.-',label='Sunday')
ax2.set_xlabel('Sunday')
...