Python:循环中的子图:第一个面板出现在错误位置

48

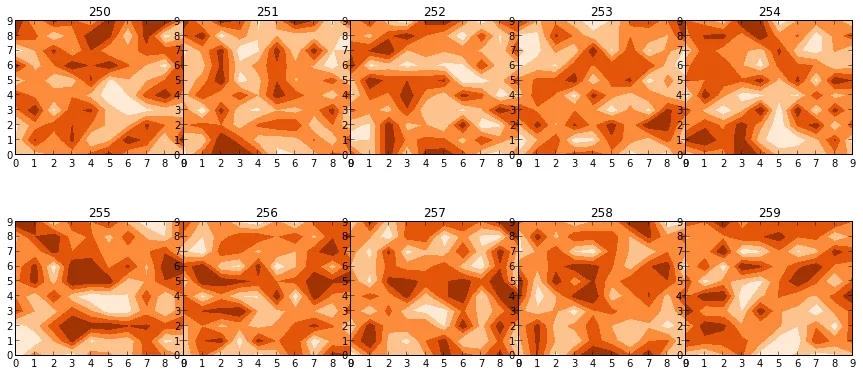
我对Python比较陌生,更熟悉Matlab。 我正在尝试制作一系列2 x 5的等高线子图。到目前为止,我的方法是将我的Matlab代码转换为Python,并在循环中绘制我的子图。相关代码如下:

fig=plt.figure(figsize=(15, 6),facecolor='w', edgecolor='k')
for i in range(10):

    #this part is just arranging the data for contourf 
    ind2 = py.find(zz==i+1)
    sfr_mass_mat = np.reshape(sfr_mass[ind2],(pixmax_x,pixmax_y))
    sfr_mass_sub = sfr_mass[ind2]
    zi = griddata(massloclist, sfrloclist, sfr_mass_sub,xi,yi,interp='nn')


    temp = 250+i  # this is to index the position of the subplot
    ax=plt.subplot(temp)
    ax.contourf(xi,yi,zi,5,cmap=plt.cm.Oranges)
    plt.subplots_adjust(hspace = .5,wspace=.001)

    #just annotating where each contour plot is being placed
    ax.set_title(str(temp))
作为这个论坛的新手,我似乎无法附加结果图片。然而,根据我的代码中的索引“temp”,2 x 5 面板的布局如下:
251 - 252 - 253 - 254 - 255
256 - 257 - 258 - 259 - 250

然而,我想要的是

250 - 251 - 252 - 253 - 254
255 - 256 - 257 - 258 - 259 

也就是说,第一个面板(250)出现在我认为应该是259的最后位置。而251似乎是我想要放置250的地方。它们所有的顺序都正确,只是循环移位了一个位置。

我知道这一定是一些非常愚蠢的问题,但感激您所能提供的任何帮助。

提前感谢您。

3个回答

137

使用您的代码和一些随机数据,这将起作用:

fig, axs = plt.subplots(2,5, figsize=(15, 6), facecolor='w', edgecolor='k')
fig.subplots_adjust(hspace = .5, wspace=.001)

axs = axs.ravel()

for i in range(10):

    axs[i].contourf(np.random.rand(10,10),5,cmap=plt.cm.Oranges)
    axs[i].set_title(str(250+i))
布局有点凌乱,但这是由于您当前的设置(figsize、wspace等)造成的。 enter image description here

2
谢谢您的快速回复!您的更改已经完美地发挥作用,并稍微简化了我的代码 :) 非常感谢!! - russell johnston
你好!@Rutger Kassies,我该如何在图表中隐藏y轴,只保留第一个? - JCV
@Jennifer Barreta,请在“plt.subplots”中添加“sharey=True”关键字。 - Rutger Kassies
10
axs = axs.ravel() 在这里的妙处在于它能够将数组扁平化。 - seralouk
我已经寻找这段代码片段太久了。谢谢! - Hakan Erdol

9

这个解决方案与Rutger Kassies提供的基本相同,但使用更符合Python语法的方式:

fig, axs = plt.subplots(2,5, figsize=(15, 6), facecolor='w', edgecolor='k')
fig.subplots_adjust(hspace = .5, wspace=.001)

data = np.arange(250, 260)

for ax, d in zip(axs.ravel(), data):
    ax.contourf(np.random.rand(10,10), 5, cmap=plt.cm.Oranges)
    ax.set_title(str(d))

7
问题在于索引subplot的使用。子图从1开始计数!因此,您的代码需要这样写:
fig=plt.figure(figsize=(15, 6),facecolor='w', edgecolor='k')
for i in range(10):

    #this part is just arranging the data for contourf 
    ind2 = py.find(zz==i+1)
    sfr_mass_mat = np.reshape(sfr_mass[ind2],(pixmax_x,pixmax_y))
    sfr_mass_sub = sfr_mass[ind2]
    zi = griddata(massloclist, sfrloclist, sfr_mass_sub,xi,yi,interp='nn')


    temp = 251+i  # this is to index the position of the subplot
    ax=plt.subplot(temp)
    ax.contourf(xi,yi,zi,5,cmap=plt.cm.Oranges)
    plt.subplots_adjust(hspace = .5,wspace=.001)

    #just annotating where each contour plot is being placed
    ax.set_title(str(temp))

请注意计算temp的那一行发生了变化。

感谢David的快速回复...我按照你建议的进行了更改,虽然面板现在都以正确的顺序出现了,但最后一个面板窗口却因某种原因变得更窄和挤压。 - russell johnston
@russelljohnston,你添加了colorbar命令吗?这将总是从最后一组坐标轴中夺取空间。 - esmit
嗨Esmit,我没有添加colorbar命令。由于时间紧迫,Rutger提供的修复方法意味着我还没有探索原始方法的潜在问题。谢谢。 - russell johnston

网页内容由stack overflow 提供, 点击上面的
可以查看英文原文,
原文链接