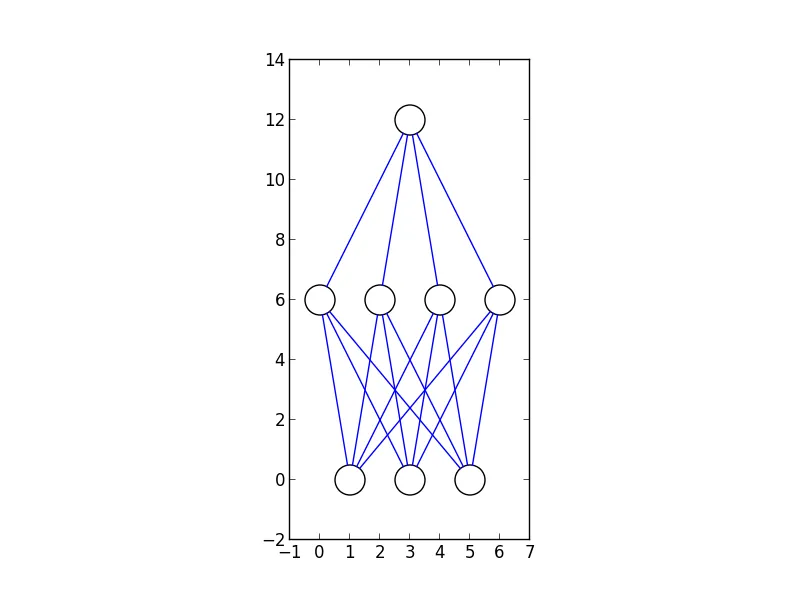
如何可视化神经网络

32
我想为神经网络绘制一个动态图片,以观察权重和神经元在学习过程中的激活变化。我该如何在Python中模拟这个过程?
更具体地说,如果网络结构是:[1000, 300, 50],那么我希望绘制一个包含1000、300和50个神经元的三层神经网络。此外,我希望图片能够反映每个时期每层神经元的饱和度。
我不知道怎么做。有人能给我指点一下吗?

2
graphwiz? - Fredrik Pihl
它们需要同时可见(带有值)吗? - Caramiriel
@Caramiriel 是的。有没有支持这个需求的软件包? - fishiwhj
9个回答

36

我根据 Milo 的答案进行了一些修改

from matplotlib import pyplot
from math import cos, sin, atan


class Neuron():
    def __init__(self, x, y):
        self.x = x
        self.y = y

    def draw(self, neuron_radius):
        circle = pyplot.Circle((self.x, self.y), radius=neuron_radius, fill=False)
        pyplot.gca().add_patch(circle)


class Layer():
    def __init__(self, network, number_of_neurons, number_of_neurons_in_widest_layer):
        self.vertical_distance_between_layers = 6
        self.horizontal_distance_between_neurons = 2
        self.neuron_radius = 0.5
        self.number_of_neurons_in_widest_layer = number_of_neurons_in_widest_layer
        self.previous_layer = self.__get_previous_layer(network)
        self.y = self.__calculate_layer_y_position()
        self.neurons = self.__intialise_neurons(number_of_neurons)

    def __intialise_neurons(self, number_of_neurons):
        neurons = []
        x = self.__calculate_left_margin_so_layer_is_centered(number_of_neurons)
        for iteration in xrange(number_of_neurons):
            neuron = Neuron(x, self.y)
            neurons.append(neuron)
            x += self.horizontal_distance_between_neurons
        return neurons

    def __calculate_left_margin_so_layer_is_centered(self, number_of_neurons):
        return self.horizontal_distance_between_neurons * (self.number_of_neurons_in_widest_layer - number_of_neurons) / 2

    def __calculate_layer_y_position(self):
        if self.previous_layer:
            return self.previous_layer.y + self.vertical_distance_between_layers
        else:
            return 0

    def __get_previous_layer(self, network):
        if len(network.layers) > 0:
            return network.layers[-1]
        else:
            return None

    def __line_between_two_neurons(self, neuron1, neuron2):
        angle = atan((neuron2.x - neuron1.x) / float(neuron2.y - neuron1.y))
        x_adjustment = self.neuron_radius * sin(angle)
        y_adjustment = self.neuron_radius * cos(angle)
        line = pyplot.Line2D((neuron1.x - x_adjustment, neuron2.x + x_adjustment), (neuron1.y - y_adjustment, neuron2.y + y_adjustment))
        pyplot.gca().add_line(line)

    def draw(self, layerType=0):
        for neuron in self.neurons:
            neuron.draw( self.neuron_radius )
            if self.previous_layer:
                for previous_layer_neuron in self.previous_layer.neurons:
                    self.__line_between_two_neurons(neuron, previous_layer_neuron)
        # write Text
        x_text = self.number_of_neurons_in_widest_layer * self.horizontal_distance_between_neurons
        if layerType == 0:
            pyplot.text(x_text, self.y, 'Input Layer', fontsize = 12)
        elif layerType == -1:
            pyplot.text(x_text, self.y, 'Output Layer', fontsize = 12)
        else:
            pyplot.text(x_text, self.y, 'Hidden Layer '+str(layerType), fontsize = 12)

class NeuralNetwork():
    def __init__(self, number_of_neurons_in_widest_layer):
        self.number_of_neurons_in_widest_layer = number_of_neurons_in_widest_layer
        self.layers = []
        self.layertype = 0

    def add_layer(self, number_of_neurons ):
        layer = Layer(self, number_of_neurons, self.number_of_neurons_in_widest_layer)
        self.layers.append(layer)

    def draw(self):
        pyplot.figure()
        for i in range( len(self.layers) ):
            layer = self.layers[i]
            if i == len(self.layers)-1:
                i = -1
            layer.draw( i )
        pyplot.axis('scaled')
        pyplot.axis('off')
        pyplot.title( 'Neural Network architecture', fontsize=15 )
        pyplot.show()

class DrawNN():
    def __init__( self, neural_network ):
        self.neural_network = neural_network

    def draw( self ):
        widest_layer = max( self.neural_network )
        network = NeuralNetwork( widest_layer )
        for l in self.neural_network:
            network.add_layer(l)
        network.draw()

现在图层也被标记了,轴已被删除,构建绘图更加容易。只需执行:

network = DrawNN( [2,8,8,1] )
network.draw()

这里构建了一个具有以下结构的神经网络:

  • 输入层中有2个神经元
  • 第1个隐藏层中有8个神经元
  • 第2个隐藏层中有8个神经元
  • 输出层中有1个神经元enter image description here

嗨,最近发现了您的神经网络可视化工具。我试过了,但是它没有为我工作。更确切地说,我得到的错误是名称'plotNN'未定义。我已经检查了缩进,但无法让它工作@OliBlum - Yags
DrawNN([2,8,8,1]).draw() 可以正常运行。我也在我的帖子中进行了调整。 - Oliver Wilken
谢谢,它可以工作,你只需要更改:for iteration in xrange(number_of_neurons) 为 for iteration in range(number_of_neurons)。 - Yags
有没有办法改善绘图的外观?我正在使用一个具有1个输入、3个隐藏层和1个输出层的大型神经网络,其中神经元数量为(36,60,50,40,30,4)。 - Dorian IL

13

Python库matplotlib提供了绘制圆圈和线条的方法,还允许动画。

我编写了一些示例代码以说明如何完成此操作。我的代码生成一个神经网络的简单静态图,其中每个神经元都连接到前一层中的每个神经元。需要进一步的工作才能使其动画化。

我也将其放在一个Git存储库中.

生成的神经网络图

from matplotlib import pyplot
from math import cos, sin, atan


class Neuron():
    def __init__(self, x, y):
        self.x = x
        self.y = y

    def draw(self):
        circle = pyplot.Circle((self.x, self.y), radius=neuron_radius, fill=False)
        pyplot.gca().add_patch(circle)


class Layer():
    def __init__(self, network, number_of_neurons):
        self.previous_layer = self.__get_previous_layer(network)
        self.y = self.__calculate_layer_y_position()
        self.neurons = self.__intialise_neurons(number_of_neurons)

    def __intialise_neurons(self, number_of_neurons):
        neurons = []
        x = self.__calculate_left_margin_so_layer_is_centered(number_of_neurons)
        for iteration in xrange(number_of_neurons):
            neuron = Neuron(x, self.y)
            neurons.append(neuron)
            x += horizontal_distance_between_neurons
        return neurons

    def __calculate_left_margin_so_layer_is_centered(self, number_of_neurons):
        return horizontal_distance_between_neurons * (number_of_neurons_in_widest_layer - number_of_neurons) / 2

    def __calculate_layer_y_position(self):
        if self.previous_layer:
            return self.previous_layer.y + vertical_distance_between_layers
        else:
            return 0

    def __get_previous_layer(self, network):
        if len(network.layers) > 0:
            return network.layers[-1]
        else:
            return None

    def __line_between_two_neurons(self, neuron1, neuron2):
        angle = atan((neuron2.x - neuron1.x) / float(neuron2.y - neuron1.y))
        x_adjustment = neuron_radius * sin(angle)
        y_adjustment = neuron_radius * cos(angle)
        line = pyplot.Line2D((neuron1.x - x_adjustment, neuron2.x + x_adjustment), (neuron1.y - y_adjustment, neuron2.y + y_adjustment))
        pyplot.gca().add_line(line)

    def draw(self):
        for neuron in self.neurons:
            neuron.draw()
            if self.previous_layer:
                for previous_layer_neuron in self.previous_layer.neurons:
                    self.__line_between_two_neurons(neuron, previous_layer_neuron)


class NeuralNetwork():
    def __init__(self):
        self.layers = []

    def add_layer(self, number_of_neurons):
        layer = Layer(self, number_of_neurons)
        self.layers.append(layer)

    def draw(self):
        for layer in self.layers:
            layer.draw()
        pyplot.axis('scaled')
        pyplot.show()

if __name__ == "__main__":
    vertical_distance_between_layers = 6
    horizontal_distance_between_neurons = 2
    neuron_radius = 0.5
    number_of_neurons_in_widest_layer = 4
    network = NeuralNetwork()
    network.add_layer(3)
    network.add_layer(4)
    network.add_layer(1)
    network.draw()

9
为了实现Mykhaylo所建议的内容,我稍微修改了Milo的代码,以便提供权重作为参数来影响每行的宽度。这个参数是可选的,因为为最后一层提供权重没有意义。
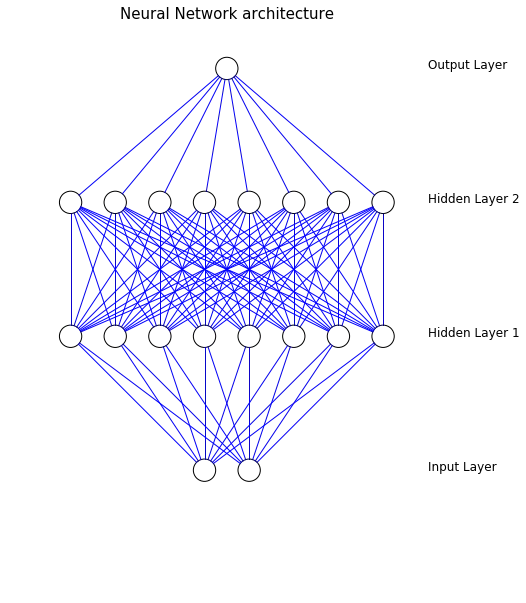
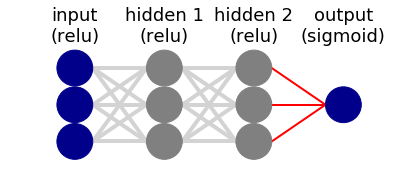
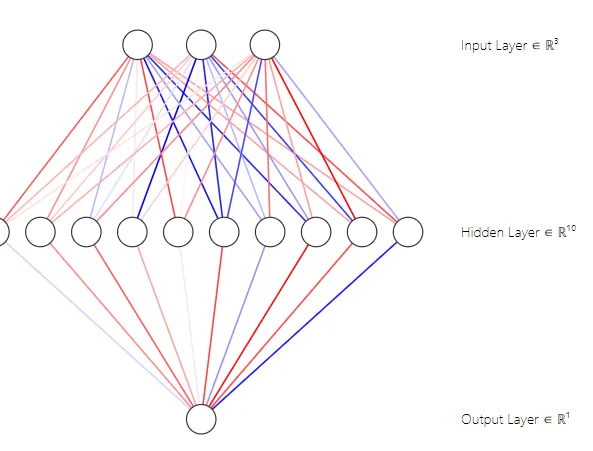
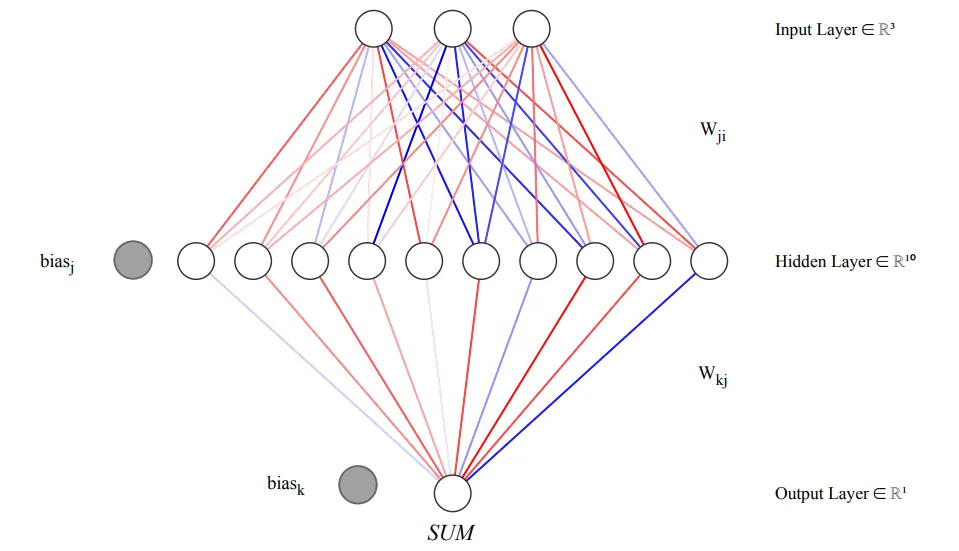
 所有这些都是为了能够可视化我的解决方案这个神经网络练习。我给出了二进制权重(0或1),这样权重为零的线就不会被绘制出来(以使图像更清晰)。
from matplotlib import pyplot
from math import cos, sin, atan
import numpy as np


class Neuron():
    def __init__(self, x, y):
        self.x = x
        self.y = y

    def draw(self):
        circle = pyplot.Circle((self.x, self.y), radius=neuron_radius, fill=False)
        pyplot.gca().add_patch(circle)


class Layer():
    def __init__(self, network, number_of_neurons, weights):
        self.previous_layer = self.__get_previous_layer(network)
        self.y = self.__calculate_layer_y_position()
        self.neurons = self.__intialise_neurons(number_of_neurons)
        self.weights = weights

    def __intialise_neurons(self, number_of_neurons):
        neurons = []
        x = self.__calculate_left_margin_so_layer_is_centered(number_of_neurons)
        for iteration in range(number_of_neurons):
            neuron = Neuron(x, self.y)
            neurons.append(neuron)
            x += horizontal_distance_between_neurons
        return neurons

    def __calculate_left_margin_so_layer_is_centered(self, number_of_neurons):
        return horizontal_distance_between_neurons * (number_of_neurons_in_widest_layer - number_of_neurons) / 2

    def __calculate_layer_y_position(self):
        if self.previous_layer:
            return self.previous_layer.y + vertical_distance_between_layers
        else:
            return 0

    def __get_previous_layer(self, network):
        if len(network.layers) > 0:
            return network.layers[-1]
        else:
            return None

    def __line_between_two_neurons(self, neuron1, neuron2, linewidth):
        angle = atan((neuron2.x - neuron1.x) / float(neuron2.y - neuron1.y))
        x_adjustment = neuron_radius * sin(angle)
        y_adjustment = neuron_radius * cos(angle)
        line_x_data = (neuron1.x - x_adjustment, neuron2.x + x_adjustment)
        line_y_data = (neuron1.y - y_adjustment, neuron2.y + y_adjustment)
        line = pyplot.Line2D(line_x_data, line_y_data, linewidth=linewidth)
        pyplot.gca().add_line(line)

    def draw(self):
        for this_layer_neuron_index in range(len(self.neurons)):
            neuron = self.neurons[this_layer_neuron_index]
            neuron.draw()
            if self.previous_layer:
                for previous_layer_neuron_index in range(len(self.previous_layer.neurons)):
                    previous_layer_neuron = self.previous_layer.neurons[previous_layer_neuron_index]
                    weight = self.previous_layer.weights[this_layer_neuron_index, previous_layer_neuron_index]
                    self.__line_between_two_neurons(neuron, previous_layer_neuron, weight)


class NeuralNetwork():
    def __init__(self):
        self.layers = []

    def add_layer(self, number_of_neurons, weights=None):
        layer = Layer(self, number_of_neurons, weights)
        self.layers.append(layer)

    def draw(self):
        for layer in self.layers:
            layer.draw()
        pyplot.axis('scaled')
        pyplot.show()


if __name__ == "__main__":
    vertical_distance_between_layers = 6
    horizontal_distance_between_neurons = 2
    neuron_radius = 0.5
    number_of_neurons_in_widest_layer = 4
    network = NeuralNetwork()
    # weights to convert from 10 outputs to 4 (decimal digits to their binary representation)
    weights1 = np.array([\
                         [0,0,0,0,0,0,0,0,1,1],\
                         [0,0,0,0,1,1,1,1,0,0],\
                         [0,0,1,1,0,0,1,1,0,0],\
                         [0,1,0,1,0,1,0,1,0,1]])
    network.add_layer(10, weights1)
    network.add_layer(4)
    network.draw()

9
这里有一个基于matplotlib的库,名为viznet(pip install viznet)。开头,你可以阅读这个notebook。这是一个例子enter image description here
Viznet定义了一组brush rules
node1 >> (0, 1.2)  # put a node centered at axis (0, 1.2)
node2 >> (2, 0)    # put a node centered at axis (2, 0)
edge >> (node1, node2)  # connect two nodes

在这里,node1和node2是两个节点笔刷,例如node1 = NodeBrush('nn.input', ax=d.ax, size='normal')

第一个参数定义了节点的主题。对于神经网络节点(主题以'nn.'开头),其样式参考自神经网络动物园页面进入图像描述

对于边缘,我们可以定义它的画笔,如edge = EdgeBrush('->', ax=d.ax, lw=2)。第一个参数是主题,'-'表示直线,'.'表示虚线,'='表示双线,'>','<'是左箭头和右箭头。主题代码中'-','.'和'='的比例决定了它们在线条中的长度。例如,'->'和'->-'分别表示带有箭头和中心箭头的线。以下是几个示例enter image description here 仅使用节点和边缘是不够的,连接规则起着根本作用。除了基本的连接规则之外,您还可以在节点上创建引脚。我将在此处停止并留给文档。这些灵活的功能使其能够绘制张量网络量子电路
这个项目刚刚发布了v0.1版本,我将继续改进它。 您可以访问其Github repo 获取最新版本,并欢迎进行拉取请求发布问题

5

这个解决方案涉及Python和LaTeX两者。对于你的情况可能有些过度,但结果非常美观,适用于更复杂的现代架构(深度学习等),所以我想在这里提一下。首先需要在Python中定义你的网络,例如这个:

import sys
sys.path.append('../')
from pycore.tikzeng import *

# defined your arch
arch = [
    to_head( '..' ),
    to_cor(),
    to_begin(),
    to_Conv("conv1", 512, 64, offset="(0,0,0)", to="(0,0,0)", height=64, depth=64, width=2 ),
    to_Pool("pool1", offset="(0,0,0)", to="(conv1-east)"),
    to_Conv("conv2", 128, 64, offset="(1,0,0)", to="(pool1-east)", height=32, depth=32, width=2 ),
    to_connection( "pool1", "conv2"), 
    to_Pool("pool2", offset="(0,0,0)", to="(conv2-east)", height=28, depth=28, width=1),
    to_SoftMax("soft1", 10 ,"(3,0,0)", "(pool1-east)", caption="SOFT"  ),
    to_connection("pool2", "soft1"),    
    to_end()
    ]

def main():
    namefile = str(sys.argv[0]).split('.')[0]
    to_generate(arch, namefile + '.tex' )

if __name__ == '__main__':
    main()

之后,您会生成一张TikZ图像...
bash ../tikzmake.sh my_arch

...这将为您生成一个带有您的网络的PDF:

enter image description here

在存储库中提供了示例,以下是其中之一。我已在OS X上进行了测试,应该也可以在Linux上工作。不确定Windows如何。当然,您需要安装LaTeX发行版。

enter image description here


2
我曾经遇到过同样的问题,没有找到好的解决方案,所以我创建了一个库来进行简单的绘图。这里是一个绘制3层神经网络的示例:
Original Answer翻译成"最初的回答"
from nnv import NNV

layersList = [
    {"title":"input\n(relu)", "units": 3, "color": "darkBlue"},
    {"title":"hidden 1\n(relu)", "units": 3},
    {"title":"hidden 2\n(relu)", "units": 3, "edges_color":"red", "edges_width":2},
    {"title":"output\n(sigmoid)", "units": 1,"color": "darkBlue"},
]

NNV(layersList).render(save_to_file="my_example.png")

您可以通过以下方式安装该库:

输入图像描述

最初的回答:

pip install nnv

最初的回答:您可以在以下网址了解更多相关信息: https://github.com/renatosc/nnv/

是的。线条在圆圈/节点的前面,看起来不太美观。是否有可能将线条置于圆圈的后面? - Case Msee
此外,我正在尝试将“白色设置为节点(输入层)”和“黑色设置为节点边缘/边框”,但我无法做到。 - Case Msee
我会在这个周末检查并添加这些调整。也可以随意在 Github 存储库中打开一个问题。 - rsc
@CaseMsee 我更新了pip包和上面的示例。 - rsc
谢谢。我正在尝试在节点(输入层)中设置白色,并在节点边缘/边框中设置黑色。但是我无法做到这一点。 - Case Msee
显示剩余3条评论

1
用圆圈表示节点,用线连接它们以绘制网络。线的宽度必须与权重成比例。即使没有线,也可以显示非常小的权重。

1

这是我的做法:

  • 前往Alex的在线图表创建器:这里
  • 使用FCNN(全连接神经网络)绘制您的浅层网络(仅由输入-隐藏-输出层组成)
  • 或使用LeNet或AlexNet样式绘制深层/卷积网络。您现在应该有:Shallow FCNN
  • 使用draw.io上的在线工具编辑svg文件。为此,只需将svg文件导入您的工作区即可。最终效果应如下所示:

enter image description here


有没有办法将自己的权重添加到这个图中? - user157522

1
这是一个使用Keras构建神经网络的项目(您可以pip install kviz)。 您应该能够在不进行太多更改的情况下,将此代码适应于不同的NN库。
我没有在其他答案中看到的内容是我想在这里添加的,即不同数据点的激活动画: enter image description here 如果您有许多数据点并且要在训练之前(左侧)和之后(右侧)可视化激活,则可以加快速度: enter image description here 所有这些都是使用animate_activations方法 here 完成的。 这对我来说非常有帮助,可以捕获网络架构中的冗余,死神经元等。

网页内容由stack overflow 提供, 点击上面的
可以查看英文原文,
原文链接