如何测量Hibernate的性能?我想知道Hibernate执行查询所需的时间。
4个回答
11
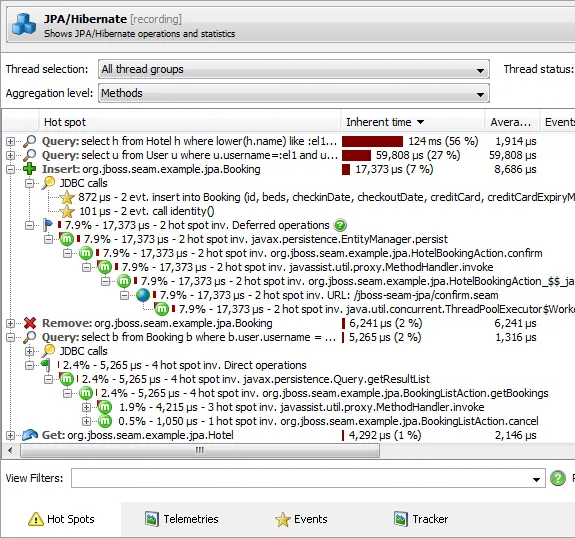
JProfiler 7.1带有一个JPA/Hibernate探针:
http://www.ej-technologies.com/products/jprofiler/whatsnew71.html
这里有一个演示如何使用它的屏幕录像:
http://blog.ej-technologies.com/2012/01/profiling-jpahibernate.html
热点视图看起来像这样:
声明:我的公司开发了JProfiler。
- Ingo Kegel
7
当我使用Spring Hibernate进行开发时,通常在我的application.properties文件中使用以下属性来查看查询执行时间以及查询的执行方式:
spring.jpa.properties.hibernate.show_sql=true
spring.jpa.properties.hibernate.use_sql_comments=true
spring.jpa.properties.hibernate.format_sql=true
spring.jpa.properties.hibernate.generate_statistics=true
示例日志输出如下所示:
Hibernate:
select
    order0_.OrderID as OrderID1_4_0_,
    order0_.customerID as customer2_4_0_,
    order0_.employeeID as employee3_4_0_,
    order0_.freight as freight4_4_0_,
    order0_.orderDate as orderDat5_4_0_,
    order0_.requiredDate as required6_4_0_,
    order0_.shipAddress as shipAddr7_4_0_,
    order0_.shipCity as shipCity8_4_0_,
    order0_.shipCountry as shipCoun9_4_0_,
    order0_.shipName as shipNam10_4_0_,
    order0_.shipPostalCode as shipPos11_4_0_,
    order0_.shipRegion as shipReg12_4_0_,
    order0_.shipVia as shipVia13_4_0_,
    order0_.shippedDate as shipped14_4_0_,
    customer1_.customerID as customer1_2_1_,
    customer1_.address as address2_2_1_,
    customer1_.city as city3_2_1_,
    customer1_.companyName as companyN4_2_1_,
    customer1_.contactName as contactN5_2_1_,
    customer1_.contactTitle as contactT6_2_1_,
    customer1_.country as country7_2_1_,
    customer1_.fax as fax8_2_1_,
    customer1_.phone as phone9_2_1_,
    customer1_.postalCode as postalC10_2_1_,
    customer1_.region as region11_2_1_
from
    orders order0_
left outer join
    customers customer1_
        on order0_.customerID=customer1_.customerID
where
    order0_.OrderID=?
Hibernate:
select
    orderdetai0_.OrderID as OrderID6_3_0_,
    orderdetai0_.ID as ID1_3_0_,
    orderdetai0_.ID as ID1_3_1_,
    orderdetai0_.discount as discount2_3_1_,
    orderdetai0_.OrderID as OrderID6_3_1_,
    orderdetai0_.productID as productI3_3_1_,
    orderdetai0_.quantity as quantity4_3_1_,
    orderdetai0_.unitPrice as unitPric5_3_1_
from
    order_details orderdetai0_
where
    orderdetai0_.OrderID=?

Session Metrics {
281879 nanoseconds spent acquiring 1 JDBC connections;
0 nanoseconds spent releasing 0 JDBC connections;
276015 nanoseconds spent preparing 2 JDBC statements;
1702274 nanoseconds spent executing 2 JDBC statements;
0 nanoseconds spent executing 0 JDBC batches;
0 nanoseconds spent performing 0 L2C puts;
0 nanoseconds spent performing 0 L2C hits;
0 nanoseconds spent performing 0 L2C misses;
0 nanoseconds spent executing 0 flushes (flushing a total of 0 entities and 0 collections);
0 nanoseconds spent executing 0 partial-flushes (flushing a total of 0 entities and 0 collections)}
- lord5et
5
我会推荐以下一种或几种选项:
- 数据库分析器 (例如SqlServer Profiler)
- Hibernate内置统计信息 (参见: http://www.javalobby.org/java/forums/t19807.html)
- Hibernate分析器 (参见: http://hibernateprofiler.com, http://nhprof.com/)
- Juggernaut
1
你是指查询本身还是查询加上将数据转换为Java对象的过程?
无论哪种方式,如果你想要科学地进行性能分析,使用像JProbe这样的性能分析工具可能是最好的选择。你不一定需要花钱,Eclipse中也有一些免费的工具。
在最简单的情况下,只需在相关代码周围添加几个打印语句就足够了,如果你要测量的是主要处理过程。
进行彻底的性能分析需要非常小心。通常情况下,你需要运行多次测试以确保你不会被初始开销(如打开与数据库的连接)所误导。而且不要忘记,数据库和性能很可能是关键因素,Hibernate本身对于调整不良的数据库无能为力。
- djna
2
感谢您的回复。您是否有任何特定的免费工具或Eclipse插件,用于对Hibernate进行性能分析? - kandarp
我在谷歌上搜索时看到了http://www.eclipse.org/tptp/,虽然我自己从未使用过它,但肯定值得一试。 - djna
网页内容由stack overflow 提供, 点击上面的可以查看英文原文,
原文链接
原文链接