我已经查看了这两个线程,但我仍然难以从一组
我的数组看起来像这样:
当我运行这个程序时,会收到一个错误:
我不确定接下来该怎么办,我不需要答案,但希望能指点正确的方向。
我希望输出的外观类似于这个,但使用我的数据: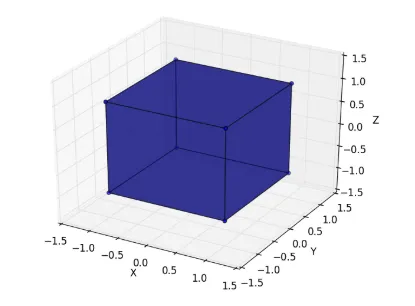 更新:如果在
 这非常接近,但我想要所有的侧面都被填充。只有一个面被显示为填充。我添加了点坐标以显示边界。我觉得这跟我创建的
numpy的x, y, z坐标中制作一个3D表面图。我的数组看起来像这样:
>>> points
array([[ 322697.1875    , 3663966.5       ,  -30000.        ],
       [ 325054.34375   , 3663966.5       ,  -30000.        ],
       [ 325054.34375   , 3665679.5       ,  -30000.        ],
       [ 322697.1875    , 3665679.5       ,  -30000.        ],
       [ 322697.1875    , 3663966.5       ,  -27703.12304688],
       [ 325054.34375   , 3663966.5       ,  -27703.15429688],
       [ 325054.34375   , 3665679.5       ,  -27703.70703125],
       [ 322697.1875    , 3665679.5       ,  -27703.67382812]])
ax.plot_surface 接受 x, y, z 点,因此我将上面的数组分成了以下几个部分:
x = points[:, 0]
y = points[:, 1]
z = points[:, 2]
我随后将其放入网格中,以便传递给ax.plot_surface():
import numpy as np
X, Y, Z = np.meshgrid(x, y, z)
然后尝试进行绘图:
import matplotlib.pyplot as plt
from mpl_toolkits.mplot3d import Axes3D
fig = plt.figure(figsize=(16,10))
ax = plt.axes(projection = '3d')
ax.plot_surface(X, Y, Z, alpha=0.5)
plt.show()
当我运行这个程序时,会收到一个错误:
rows, cols = Z.shape ValueError: too many values to unpack (expected 2)。我不确定接下来该怎么办,我不需要答案,但希望能指点正确的方向。
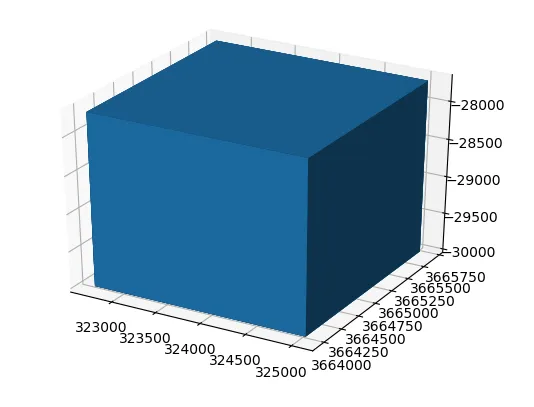
我希望输出的外观类似于这个,但使用我的数据:
更新:如果在meshgrid中不包括z,而只包括x和y,当我运行ax.plot_surface(X, Y, z, alpha=0.5)时,就会得到这样的输出:
这非常接近,但我想要所有的侧面都被填充。只有一个面被显示为填充。我添加了点坐标以显示边界。我觉得这跟我创建的meshgrid有关。这是X,Y的输出结果:>>> X, Y = np.meshgrid(x, y)
(array([[322697.1875 , 325054.34375, 325054.34375, 322697.1875 ,
322697.1875 , 325054.34375, 325054.34375, 322697.1875 ],
[322697.1875 , 325054.34375, 325054.34375, 322697.1875 ,
322697.1875 , 325054.34375, 325054.34375, 322697.1875 ],
[322697.1875 , 325054.34375, 325054.34375, 322697.1875 ,
322697.1875 , 325054.34375, 325054.34375, 322697.1875 ],
[322697.1875 , 325054.34375, 325054.34375, 322697.1875 ,
322697.1875 , 325054.34375, 325054.34375, 322697.1875 ],
[322697.1875 , 325054.34375, 325054.34375, 322697.1875 ,
322697.1875 , 325054.34375, 325054.34375, 322697.1875 ],
[322697.1875 , 325054.34375, 325054.34375, 322697.1875 ,
322697.1875 , 325054.34375, 325054.34375, 322697.1875 ],
[322697.1875 , 325054.34375, 325054.34375, 322697.1875 ,
322697.1875 , 325054.34375, 325054.34375, 322697.1875 ],
[322697.1875 , 325054.34375, 325054.34375, 322697.1875 ,
322697.1875 , 325054.34375, 325054.34375, 322697.1875 ]]), array([[3663966.5, 3663966.5, 3663966.5, 3663966.5, 3663966.5, 3663966.5,
3663966.5, 3663966.5],
[3663966.5, 3663966.5, 3663966.5, 3663966.5, 3663966.5, 3663966.5,
3663966.5, 3663966.5],
[3665679.5, 3665679.5, 3665679.5, 3665679.5, 3665679.5, 3665679.5,
3665679.5, 3665679.5],
[3665679.5, 3665679.5, 3665679.5, 3665679.5, 3665679.5, 3665679.5,
3665679.5, 3665679.5],
[3663966.5, 3663966.5, 3663966.5, 3663966.5, 3663966.5, 3663966.5,
3663966.5, 3663966.5],
[3663966.5, 3663966.5, 3663966.5, 3663966.5, 3663966.5, 3663966.5,
3663966.5, 3663966.5],
[3665679.5, 3665679.5, 3665679.5, 3665679.5, 3665679.5, 3665679.5,
3665679.5, 3665679.5],
[3665679.5, 3665679.5, 3665679.5, 3665679.5, 3665679.5, 3665679.5,
3665679.5, 3665679.5]]))
如果我只取x和y的唯一值,就会抛出一个错误:
x = np.unique(x)
y = np.unique(y)

>>> x
array([322697.1875 , 325054.34375])
>>> y
array([3663966.5, 3665679.5])

X, Y = np.meshgrid(x, y)
>>> X, Y
(array([[322697.1875 , 325054.34375],
       [322697.1875 , 325054.34375]]), array([[3663966.5, 3663966.5],
       [3665679.5, 3665679.5]]))

>>> ax.plot_surface(X, Y, z, alpha=0.5)
Traceback (most recent call last):
  File "<pyshell#61>", line 1, in <module>
    ax.plot_surface(X, Y, z, alpha=0.5)
  File "/Users/NaN/anaconda/envs/py36/lib/python3.6/site-packages/mpl_toolkits/mplot3d/axes3d.py", line 1586, in plot_surface
    X, Y, Z = np.broadcast_arrays(X, Y, Z)
  File "/Users/NaN/anaconda/envs/py36/lib/python3.6/site-packages/numpy/lib/stride_tricks.py", line 259, in broadcast_arrays
    shape = _broadcast_shape(*args)
  File "/Users/NaN/anaconda/envs/py36/lib/python3.6/site-packages/numpy/lib/stride_tricks.py", line 193, in _broadcast_shape
    b = np.broadcast(*args[:32])
ValueError: shape mismatch: objects cannot be broadcast to a single shape
x和y进行网格化,并在ax.plot_surface中单独插入z,但是我得到了一个shape mismatch错误,如更新的帖子中所示。 - NaN