线性支持向量机
支持向量机是一种最大间隔分类器,即它最大化正类和负类之间分离的宽度或间隔。在二元分类的情况下,线性支持向量机的损失函数如下所示。

这可以从更一般的多类线性SVM损失(也称为铰链损失)中推导出来,如下所示(其中Δ=1)。


注意:在上述所有方程中,权重向量
w包括偏置
b。
这个损失函数是怎么想出来的?让我们深入探讨一下。
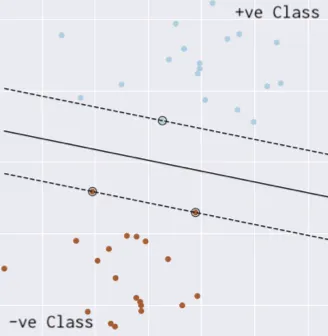
上图显示了正类数据点和负类数据点之间的分离超平面(实线)。然而,可以有许多这样的分离超平面。SVM找到分离超平面,使得超平面到最近的正数据点和最近的负数据点的距离最大(点线表示)。
数学上,SVM找到权重向量w(包括偏差),使得

如果正类和负类的标签(
y)分别为
+1和
-1,那么支持向量机将找到
w,使得

• 如果数据点在超平面的正确侧(被正确分类),那么{{执行某些操作}}。

• 如果数据点在错误的一侧(被错分),那么

因此,数据点的损失(一种衡量错误分类的指标)可以写成

正则化
如果一个权重向量w正确地分类数据(X),那么这个权重向量的任何倍数λw(其中λ>1)也将正确分类数据(零损失)。这是因为变换λW会拉伸所有得分幅度,因此也会拉伸它们的绝对差异。L2正则化通过将正则化损失添加到铰链损失中来惩罚大的权重。

例如,如果
x=[1,1,1,1]并且有两个权重向量
w1=[1,0,0,0]和
w2=[0.25,0.25,0.25,0.25]。那么
dot(W1,x) =dot(w2,x) =1即两个权重向量导致相同的点积,因此相同的铰链损失。但是
w1的L2惩罚为
1.0,而
w2的L2惩罚仅为
0.25。因此,L2正则化更喜欢
w2而不是
w1。鼓励分类器将所有输入维度考虑在内,而不是少数输入维度非常强烈地考虑一些输入维度。这可以提高模型的泛化性能,并导致过度拟合降低。
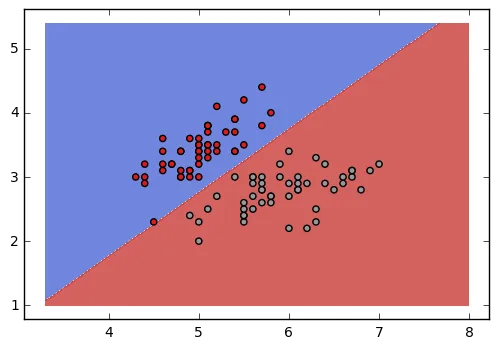
L2惩罚导致SVM中的最大边距特性。如果将SVM表示为优化问题,则受限二次优化问题的广义拉格朗日形式如下:
现在我们知道线性SVM的损失函数,可以使用梯度下降(或其他优化器)来找到最小化损失的权重向量。
代码
import tensorflow as tf
import numpy as np
import matplotlib.pyplot as plt
from sklearn import datasets
iris = datasets.load_iris()
X = iris.data[:, :2][iris.target != 2]
y = iris.target[iris.target != 2]
y = np.where(y==1, y, -1)
model = tf.keras.Sequential()
model.add(tf.keras.layers.Dense(1, activation='linear', kernel_regularizer=tf.keras.regularizers.l2()))
def hinge_loss(y_true, y_pred):
return tf.maximum(0., 1- y_true*y_pred)
model.compile(optimizer='adam', loss=hinge_loss)
model.fit(X, y, epochs=50000, verbose=False)
x_min, x_max = X[:, 0].min() - 1, X[:, 0].max() + 1
y_min, y_max = X[:, 1].min() - 1, X[:, 1].max() + 1
xx, yy = np.meshgrid(np.arange(x_min, x_max, 0.01),
np.arange(y_min, y_max, 0.01))
Z = model.predict(np.c_[xx.ravel(), yy.ravel()])
Z = Z.reshape(xx.shape)
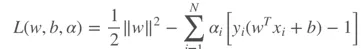
cs = plt.contourf(xx, yy, Z, cmap=plt.cm.coolwarm, alpha=0.8)
plt.scatter(X[:, 0], X[:, 1], c=y, cmap=plt.cm.Set1)
plt.show()
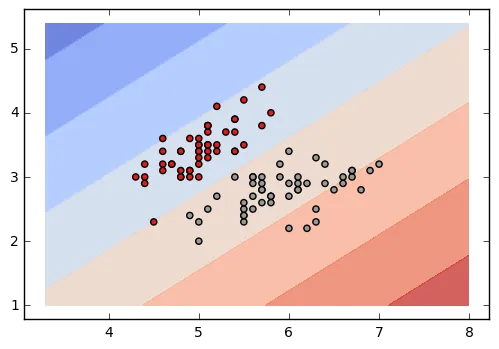
SVM也可以表示为一个受限制的二次优化问题。这种表述的优点在于我们可以使用核技巧来对非线性可分数据进行分类(使用不同的核函数)。LIBSVM实现了序列最小优化(SMO)算法,用于核支持向量机(SVMs)。
代码
from sklearn.svm import SVC
clf = SVC(kernel='linear')
clf.fit(X, y)
x_min, x_max = X[:, 0].min() - 1, X[:, 0].max() + 1
y_min, y_max = X[:, 1].min() - 1, X[:, 1].max() + 1
xx, yy = np.meshgrid(np.arange(x_min, x_max, 0.01),
np.arange(y_min, y_max, 0.01))
Z = model.predict(np.c_[xx.ravel(), yy.ravel()])
Z = Z.reshape(xx.shape)
cs = plt.contourf(xx, yy, Z, cmap=plt.cm.coolwarm, alpha=0.8)
plt.scatter(X[:, 0], X[:, 1], c=y, cmap=plt.cm.Set1)
plt.show()
最终
您可以使用基于tf的线性SVM模型来解决问题陈述:
df = pd.DataFrame(np.random.randint(0,2,size=(1000, 10)))
df[11] = np.random.uniform(0,100000, size=(1000))
df[12] = pd.DataFrame(np.random.randint(0, 2, size=(1000)))
scalar = StandardScaler().fit(df[df.columns.drop(12)])
X = scalar.transform(df[df.columns.drop(12)])
y = np.array(df[12])
y = np.where(y==1, +1, -1)
model = tf.keras.Sequential()
model.add(tf.keras.layers.Dense(1, activation='linear',
kernel_regularizer=tf.keras.regularizers.l2()))
def my_loss(y_true, y_pred):
return tf.maximum(0., 1- y_true*y_pred)
model.compile(optimizer='adam', loss=my_loss)
model.fit(X, y, epochs=100, verbose=True)
K-Fold交叉验证和预测
import tensorflow as tf
import numpy as np
import matplotlib.pyplot as plt
from sklearn import datasets
from sklearn.model_selection import KFold
from sklearn.metrics import roc_curve, auc
iris = datasets.load_iris()
X = iris.data[:, :2][iris.target != 2]
y_ = iris.target[iris.target != 2]
y = np.where(y_==1, +1, -1)
def hinge_loss(y_true, y_pred):
return tf.maximum(0., 1- y_true*y_pred)
def get_model():
model = tf.keras.Sequential()
model.add(tf.keras.layers.Dense(1, activation='linear', kernel_regularizer=tf.keras.regularizers.l2()))
model.compile(optimizer='adam', loss=hinge_loss)
return model
def sigmoid(x):
return 1 / (1 + np.exp(-x))
predict = lambda model, x : sigmoid(model.predict(x).reshape(-1))
predict_class = lambda model, x : np.where(predict(model, x)>0.5, 1, 0)
kf = KFold(n_splits=2, shuffle=True)
best = (None, -1)
for i, (train_index, test_index) in enumerate(kf.split(X)):
X_train, X_test = X[train_index], X[test_index]
y_train, y_test = y[train_index], y[test_index]
model = get_model()
model.fit(X_train, y_train, epochs=5000, verbose=False, batch_size=128)
y_pred = model.predict_classes(X_test)
val = roc_auc_score(y_test, y_pred)
print ("CV Fold {0}: AUC: {1}".format(i+1, auc))
if best[1] < val:
best = (model, val)
y_score = predict(best[0], X)
fpr, tpr, _ = roc_curve(y_, y_score)
roc_auc = auc(fpr, tpr)
print (roc_auc)
plt.figure()
lw = 2
plt.plot(fpr, tpr, color='darkorange',
lw=lw, label='ROC curve (area = %0.2f)' % roc_auc)
plt.plot([0, 1], [0, 1], color='navy', lw=lw, linestyle='--')
plt.xlim([0.0, 1.0])
plt.ylim([0.0, 1.05])
plt.xlabel('False Positive Rate')
plt.ylabel('True Positive Rate')
plt.legend(loc="lower right")
plt.show()
y_score = predict_class(best[0], X)
进行预测
由于模型的输出是线性的,我们需要将其归一化为概率以进行预测。如果是二分类问题,我们可以使用sigmoid函数;如果是多分类问题,则可以使用softmax函数。以下代码适用于二分类问题。
predict = lambda model, x : sigmoid(model.predict(x).reshape(-1))
predict_class = lambda model, x : np.where(predict(model, x)>0.5, 1, 0)
参考文献
- CS231n
更新 1:
为了使代码与 tf 2.0 兼容,y 的数据类型应与 X 相同。为此,在y = np.where(..... 行后添加 y = y.astype(np.float64)。