gnuplot - 计算两条直线之间的距离

4

gnuplot能计算两条直线或者两个点之间的距离吗?

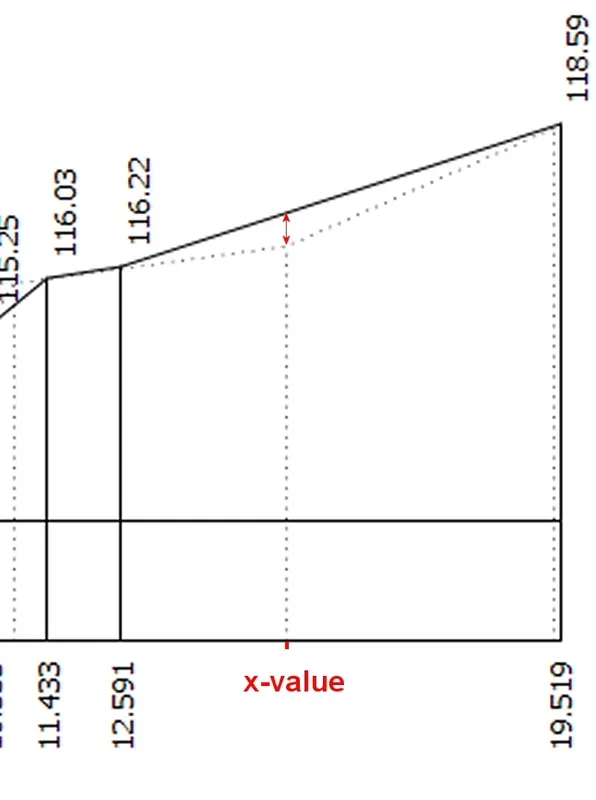
我有一个绘图,其中绘制了两条(主要)直线。目前先假设第一条直线始终在第二条直线上方。有没有一种方法可以在给定x值处计算从第2条直线到第1条直线的距离?

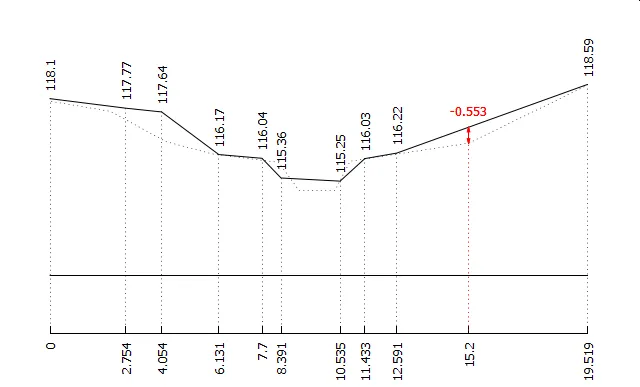
这是我的绘图样式以及我想要计算的距离的图片:

实线水平线是第一条直线,虚线水平线是第二条直线

垂直线仅用于样式,与实际绘图无关,它们的数据存储在test.dattest2.dat中。

我的直线数据文件如下:
line1

0       118.1
2.754   117.77
4.054   117.64
6.131   116.17
7.7     116.04
8.391   115.36
10.535  115.25
11.433  116.03
12.591  116.22
19.519  118.59

line2

19.4    118.51
15.2    116.56
10.9    115.94
10.35   114.93
9.05    114.92
8.3     115.9
5.9     116.19
4.2     116.62
2.2     117.66
-0.3    118.06

我的绘图代码如下:

set term wxt enhanced
cd 'working directory'
unset key

set size 0.9,0.9
set origin 0.1,0.1
set title 'TITLE'

unset border
set label 21 "  rotate by 45" at -3.0,0.0 rotate by 45 point ps 2

set xrange [0:19.519]
set yrange [110:119] 
set xtics nomirror(0, 2.745, 4.054, 6.131, 7.7, 8.391, 10.535, 11.433, 12.591, 19.519) rotate by 90 offset 0,-0.1 right

set ytics "      ", 30000

plot "line1.dat" using ($1):($2):2 with labels offset 1, 1.8 rotate by 90, "line1.dat" using 1:2 with lines lt 1 lw 1 lc rgb '#000000', +112 lt 1 lw 1 lc rgb '#000000' , 'test.dat' with lines lt 1 lw 1 lc rgb '#000000', +110 lt 1 lw 1 lc rgb '#000000', 'line2.dat' with lines lt 0.5 lw 1 lc rgb '#000000', 'test2.dat' with lines lt 0.5 lw 1 lc rgb '#000000' 
2个回答

2
您可以手动测量距离。将鼠标移到第一个点,键入“r”。然后,当您移动鼠标时,x 和 y 偏移量、距离和角度会显示出来。键入“5”来绘制线段,切换度数和正切显示。预先放大图像可以提高精度。
顺便说一下,在绘图窗口中键入“h”会将快捷键列表显示在控制台中。

0
这个“相当古老”的问题的答案可能仍然对OP有兴趣,如果不是,也许对其他人有用。是的,您可以计算和绘制两条线之间的差异。这需要一些线性插值。只需将所需的x值分配给变量myX即可。 数据:

SO17717287_1.dat

0       118.1
2.754   117.77
4.054   117.64
6.131   116.17
7.7     116.04
8.391   115.36
10.535  115.25
11.433  116.03
12.591  116.22
19.519  118.59

SO17717287_2.dat

19.4    118.51
15.2    116.56
10.9    115.94
10.35   114.93
9.05    114.92
8.3     115.9
5.9     116.19
4.2     116.62
2.2     117.66
-0.3    118.06

脚本:(适用于gnuplot>=4.6.0)

### calculating and plotting a difference between two curves
reset

FILE1 = "SO17717287_1.dat"
FILE2 = "SO17717287_2.dat"

set border 1
unset key
set origin 0.05,0.05
set size   0.9,0.8
set xrange [0:19.519]
set xtics nomirror rotate by 90 offset 0,-0.1 right
set yrange [110:119] 
unset ytics

myX = 15.2
getYa(xi) = (x0=x1, x1=$1, y0=y1, y1=$2, x1==xi ? ya=y1 : (sgn(x0-xi)!=sgn(x1-xi)) ? ya=(y1-y0)/(x1-x0)*(xi-x0)+y0 : NaN)
getYb(xi) = (x0=x1, x1=$1, y0=y1, y1=$2, x1==xi ? yb=y1 : (sgn(x0-xi)!=sgn(x1-xi)) ? yb=(y1-y0)/(x1-x0)*(xi-x0)+y0 : NaN)

set samples 2  # set to minimal possible value for plotting '+'

plot x1=y1=NaN FILE1 u 1:2:2:xtic(1) w labels offset 0,0.5 left rotate by 90, \
         '' u 1:(getYa(myX),$2) w l lc rgb 'black', \
         '' u 1:2:(0):(110-$2) w vec lt 0 nohead, \
         +112 w l lc rgb 'black', \
     x1=y1=NaN FILE2 u 1:(getYb(myX),$2) w l lt 0 lc rgb 'black', \
         '+' u (myX):(ya):(0):(yb-ya) w vec heads lc rgb "red", \
         '+' u (myX):(ya):(sprintf("%.3f",yb-ya)):xtic(sprintf("%g",myX)) w labels tc rgb "red" offset 0,1, \
         '+' u (myX):(ya):(0):(110-ya) w vec nohead lt 0 lc rgb "red"
### end of script

结果:(由gnuplot 4.6.0创建)

enter image description here


网页内容由stack overflow 提供, 点击上面的
可以查看英文原文,
原文链接