在图像中找到主要颜色

16

我想找到图片中的主要颜色。为此,我知道应该使用图片直方图。但我不确定图片格式。RGB、HSV还是灰度图片,哪一种应该使用?

计算出直方图后,我应该在直方图上找到最大值。对于HSV图像,我是否应该找到低于最大binVal值的值?为什么我的结果图片只包含黑色?

float binVal = hist.at<float>(h, s);

编辑:

我尝试了下面的代码。我绘制了h-s直方图。我的结果图像在这里。在二值阈值之后,我没有发现任何东西。也许我错误地找到最大直方图值。

输入图像描述输入图像描述

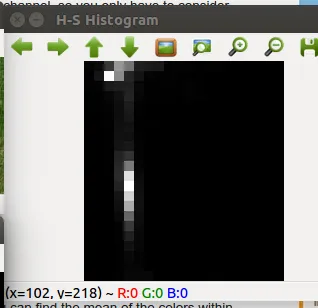
cvtColor(src, hsv, CV_BGR2HSV);

// Quantize the hue to 30 levels
// and the saturation to 32 levels
int hbins = 20, sbins = 22;
int histSize[] = {hbins, sbins};
// hue varies from 0 to 179, see cvtColor
float hranges[] = { 0, 180 };
// saturation varies from 0 (black-gray-white) to
// 255 (pure spectrum color)
float sranges[] = { 0, 256 };
const float* ranges[] = { hranges, sranges };
MatND hist;
// we compute the histogram from the 0-th and 1-st channels
int channels[] = {0, 1};

calcHist( &hsv, 1, channels, Mat(), // do not use mask
         hist, 2, histSize, ranges,
         true, // the histogram is uniform
         false );
double maxVal=0;
minMaxLoc(hist, 0, &maxVal, 0, 0);

int scale = 10;
Mat histImg = Mat::zeros(sbins*scale, hbins*10, CV_8UC3);
int maxIntensity = -100;
for( int h = 0; h < hbins; h++ ) {
    for( int s = 0; s < sbins; s++ )
    {
        float binVal = hist.at<float>(h, s);
        int intensity = cvRound(binVal*255/maxVal);
        rectangle( histImg, Point(h*scale, s*scale),
                    Point( (h+1)*scale - 1, (s+1)*scale - 1),
                    Scalar::all(intensity),
                    CV_FILLED );
        if(intensity > maxIntensity)
            maxIntensity = intensity;
    }
}
std::cout << "max Intensity " << maxVal << std::endl;
Mat dst;
cv::threshold(src, dst, maxIntensity, 255, cv::THRESH_BINARY);

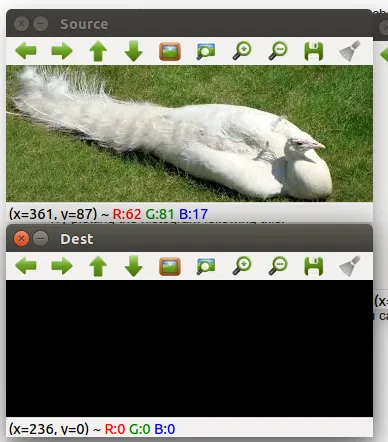
namedWindow( "Dest", 1 );
imshow( "Dest", dst );
namedWindow( "Source", 1 );
imshow( "Source", src );

namedWindow( "H-S Histogram", 1 );
imshow( "H-S Histogram", histImg );
4个回答

13

或者你可以尝试使用k-means方法。计算k个簇,其中k ~ 2..5,并将最大群组的质心作为主色。

OpenCv的Python文档有一个图示例子非常好地获取了主要颜色:


1
我需要非常快速地找到最大的颜色区域,而我的图像非常大。对于这个任务来说,这种方法是否有效? - zakjma
不,它很可能比简单的直方图慢(确切的版本甚至是 NP 完全问题)。但是,由于此任务将 N 个像素强制降维到仅一个颜色,因此您可以很可能不考虑所有像素,即首先对图像进行子采样(与您用来实际确定颜色的方法无关)。 - mbschenkel
你到底不能使用什么? - mbschenkel
抱歉我的英语不是解决问题的好方法。所以,我不应该使用knn聚类方法。 - zakjma

11

解决方案

  • 查找H-S直方图
  • 查找峰值H值(使用minmaxLoc函数)
  • 将图像分成3个通道(H,S,V)
  • 应用阈值
  • 通过合并3个通道创建图像

11

以下是使用K-Means聚类sklearn.cluster.KMeans()来确定图像中主要颜色的Python方法。


输入图像

结果

使用n_clusters=5,以下是最主要的颜色和百分比分布。

[14.69488554 34.23074345 41.48107857] 13.67%
[141.44980073 207.52576948 236.30722987] 15.69%
[ 31.75790423  77.52713644 114.33328324] 18.77%
[ 48.41205713 118.34814452 176.43411287] 25.19%
[ 84.04820266 161.6848298  217.14045211] 26.69%

每个颜色簇的可视化

enter image description here

n_clusters=10 相似,

[ 55.09073171 113.28271003  74.97528455] 3.25%
[ 85.36889668 145.80759374 174.59846237] 5.24%
[164.17201088 223.34258123 241.81929254] 6.60%
[ 9.97315932 22.79468111 22.01822211] 7.16%
[19.96940211 47.8375841  72.83728002] 9.27%
[ 26.73510467  70.5847759  124.79314278] 10.52%
[118.44741779 190.98204701 230.66728334] 13.55%
[ 51.61750364 130.59930047 198.76335878] 13.82%
[ 41.10232129 104.89923271 160.54431333] 14.53%
[ 81.70930412 161.823664   221.10258949] 16.04%

enter image description here

import cv2, numpy as np
from sklearn.cluster import KMeans

def visualize_colors(cluster, centroids):
    # Get the number of different clusters, create histogram, and normalize
    labels = np.arange(0, len(np.unique(cluster.labels_)) + 1)
    (hist, _) = np.histogram(cluster.labels_, bins = labels)
    hist = hist.astype("float")
    hist /= hist.sum()

    # Create frequency rect and iterate through each cluster's color and percentage
    rect = np.zeros((50, 300, 3), dtype=np.uint8)
    colors = sorted([(percent, color) for (percent, color) in zip(hist, centroids)])
    start = 0
    for (percent, color) in colors:
        print(color, "{:0.2f}%".format(percent * 100))
        end = start + (percent * 300)
        cv2.rectangle(rect, (int(start), 0), (int(end), 50), \
                      color.astype("uint8").tolist(), -1)
        start = end
    return rect

# Load image and convert to a list of pixels
image = cv2.imread('1.jpg')
image = cv2.cvtColor(image, cv2.COLOR_BGR2RGB)
reshape = image.reshape((image.shape[0] * image.shape[1], 3))

# Find and display most dominant colors
cluster = KMeans(n_clusters=5).fit(reshape)
visualize = visualize_colors(cluster, cluster.cluster_centers_)
visualize = cv2.cvtColor(visualize, cv2.COLOR_RGB2BGR)
cv2.imshow('visualize', visualize)
cv2.waitKey()

2
这太棒了,伙计!谢谢! - Diogo Rosa

6
以下是关于IT技术的翻译建议:

以下是一些开始的建议。

  • RGB中的所有3个通道都对颜色产生影响,因此您必须以某种方式确定三个不同的直方图在哪里都是最大的(或者它们的总和最大,或者其他什么)。
  • HSV将所有颜色(也就是色调)信息放在一个通道中,因此您只需要考虑一个直方图。
  • 灰度会丢失所有颜色信息,因此在寻找颜色时几乎没有用处。

尝试将其转换为HSV,然后计算H通道的直方图。

正如您所说,您想找到直方图中的最大值。但是:

  • 您可能希望考虑一系列值,而不仅仅是一个值,例如从20-40而不是仅使用30。尝试不同的范围大小。
  • 请记住,色调是循环的,因此H = 0H = 360是相同的。
  • 尝试按照下面链接的方式绘制直方图,以查看您的结果是否合理:
    http://docs.opencv.org/doc/tutorials/imgproc/histograms/histogram_calculation/histogram_calculation.html
  • 如果您使用了一系列色调,并找到了一个最大范围,您可以仅将该范围的中间作为主导颜色,或者您可以找到该范围内颜色的平均值并使用该值。

网页内容由stack overflow 提供, 点击上面的
可以查看英文原文,
原文链接