如何将Seaborn图保存到文件中

292
我尝试了以下代码(test_seaborn.py):
import matplotlib
matplotlib.use('Agg')
import matplotlib.pyplot as plt
matplotlib.style.use('ggplot')
import seaborn as sns
sns.set()
df = sns.load_dataset('iris')
sns_plot = sns.pairplot(df, hue='species', size=2.5)
fig = sns_plot.get_figure()
fig.savefig("output.png")
#sns.plt.show()

但是我遇到了这个错误:
  Traceback (most recent call last):
  File "test_searborn.py", line 11, in <module>
    fig = sns_plot.get_figure()
AttributeError: 'PairGrid' object has no attribute 'get_figure'
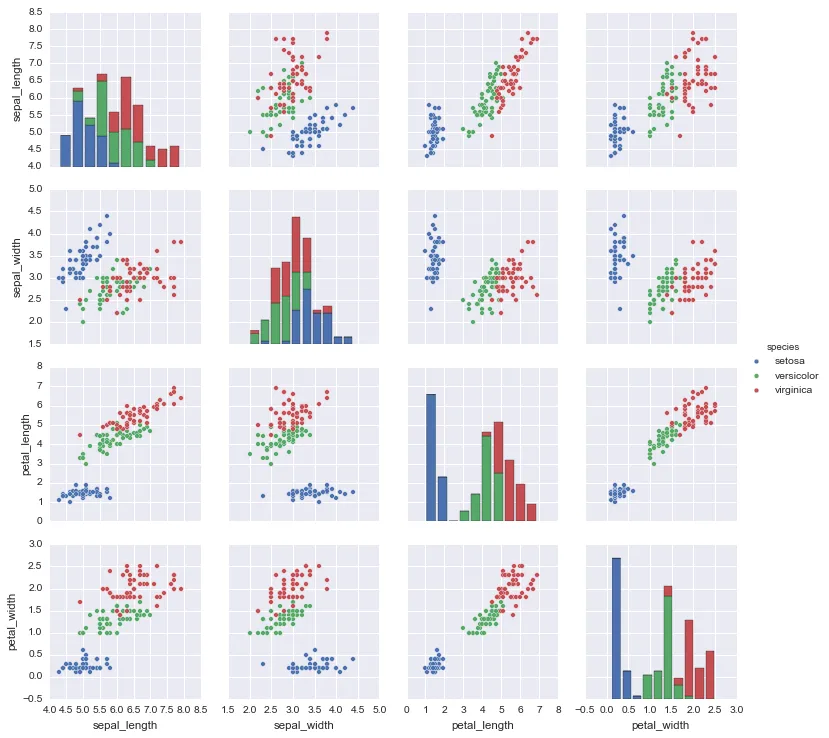
我期望最终的 output.png 存在,并且呈现如下所示:

enter image description here

如何解决这个问题?

1
@Terry Wang 的下面的答案 对我很有用 - 在 Python 2.7.12seaborn 0.7.1 中都可以使用。 - Cristian E. Nuno
3
seaborn 0.9 的一行代码:sns.regplot(x='age', y='income', data=pd.read_csv('income_data.csv')).get_figure().savefig('income_f_age.png') - Anton Tarasenko
10个回答

397
以下调用可让您访问图表(与 Seaborn 0.8.1 兼容):
swarm_plot = sns.swarmplot(...)
fig = swarm_plot.get_figure()
fig.savefig("out.png") 

如之前在这个答案中所看到的。

建议的解决方案与Seaborn 0.8.1不兼容。它们会因为Seaborn的接口发生了变化而产生以下错误:

AttributeError: 'AxesSubplot' object has no attribute 'fig'
When trying to access the figure

AttributeError: 'AxesSubplot' object has no attribute 'savefig'
when trying to use the savefig directly as a function

更新: 最近我使用了seaborn中的PairGrid对象生成了与这个例子类似的图形。 在这种情况下,由于GridPlot不像sns.swarmplot之类的绘图对象,它没有get_figure()函数。 可以直接通过以下方式访问matplotlib图形:

fig = myGridPlotObject.fig

4
我最近使用了Seaborn中的PairGrid对象,就像示例中一样。 - Salvatore Cosentino
3
我认为这是适用于PairGrid和JointGrid的唯一有效答案,我认为应该被接受。 - Ryszard Cetnarski
1
get_figure的要求保存图形非常烦人。应该可以在线将绘图保存到文件中。 - Mini Fridge

85

以上一些解决方案对我无效。当我尝试时,找不到.fig属性,因此无法直接使用.savefig()。但是,下面的方法可以解决问题:

sns_plot.figure.savefig("output.png")

我是一名较新的Python用户,所以我不知道这是否是由于更新引起的。我想提一下,以防其他人遇到和我一样的问题。


1
这对于我的seaborn.swarmplot有效,但对于seaborn.lmplot无效。 对于seaborn.lmplot,我发现sns_plot.savefig(“output.png”)像Salvatore的答案一样有效,但不需要get_figure()调用。 - Wayne
1
这对于使用 seaborn 0.11.2displot 有效。这是我能够让其正常工作的唯一答案! - Cornelius Roemer

33

2019年搜索者的结果更少:

import matplotlib.pyplot as plt
import seaborn as sns

df = sns.load_dataset('iris')
sns_plot = sns.pairplot(df, hue='species', height=2.5)
plt.savefig('output.png')

更新说明: size已更改为height


3
它产生白色图像! - Minions
1
@user_007 不确定为什么你得到了白色图像。我今天刚测试了代码,它在Jupyter Notebook和输出文件中都正常。你可能需要更新你的控制台/Python并检查你的计算机视图设置。 - Jade Cacho
1
我也有一个白色的图形。我用以下代码进行了更正: sns_plot.savefig('output.png') - Reine Baudache
也适用于PDF输出。 - undefined

17

你只需直接使用sns_plotsavefig方法即可。

sns_plot.savefig("output.png")

如果您想要清晰地处理代码,以便访问 sns_plot 所在的 matplotlib 图形,则可以直接使用以下方法获取:

sns_plot 所在的 matplotlib 图形可以通过直接获取它来实现。
fig = sns_plot.fig

在这种情况下,与您的代码假设的不同,没有 get_figure 方法。


12

我使用distplotget_figure成功保存图片。

sns_hist = sns.distplot(df_train['SalePrice'])
fig = sns_hist.get_figure()
fig.savefig('hist.png')

适用于我的环境:在 python 3.5.6 中使用 seaborn 0.9.0,函数 sns.distplot() 工作正常。此外,函数 sns.pairplot() 不需要 get_figure() 这一行代码。 - Scott Yang

11

我之前无法让其他答案起作用,最终发现这个方法在matplotlib==3.2.1版本下可以工作。如果您正在使用for循环或其他迭代方法,则这一点尤其适用。

sns.scatterplot(
    data=df_hourly, x="date_week", y="value",hue='variable'
)
plt.savefig('./f1.png')
plt.show()

请注意,在show函数调用之前,必须先调用savefig函数。否则会保存一张空白图片。


1
这真的很有帮助!谢谢。这是我在Jupyter Notebook中唯一有效的方法。 - Anscandance
1
@Anscandance 很高兴听到这个消息!是的,我也无法在笔记本中正确地使用其他解决方案。 - SriK
可以确认这个方法也适用于Matplotlib版本3.7.1。这个帖子中的其他答案都不起作用。 - sander

5
这对我很有效。
import seaborn as sns
import matplotlib.pyplot as plt
%matplotlib inline

sns.factorplot(x='holiday',data=data,kind='count',size=5,aspect=1)
plt.savefig('holiday-vs-count.png')

4

您也可以创建一个matplotlib figure对象,然后使用plt.savefig(...)进行保存:

from matplotlib import pyplot as plt
import seaborn as sns
import pandas as pd

df = sns.load_dataset('iris')
plt.figure() # Push new figure on stack
sns_plot = sns.pairplot(df, hue='species', size=2.5)
plt.savefig('output.png') # Save that figure

至少与 displot 不兼容。 - Cornelius Roemer

2

在seaborn 0.8.1中,使用sns.figure.savefig("output.png")会出现错误。

请改用以下方法:

import seaborn as sns

df = sns.load_dataset('iris')
sns_plot = sns.pairplot(df, hue='species', size=2.5)
sns_plot.savefig("output.png")

-4

仅供参考,下面的命令在seaborn 0.8.1中有效,所以我想初始答案仍然有效。

sns_plot = sns.pairplot(data, hue='species', size=3)
sns_plot.savefig("output.png")

2
虽然那段代码能够工作,但它并不完整。标题是“如何将 Seaborn 绘图保存到文件中”,这更为通用。 不幸的是,提出的解决方案只适用于 pairplot,但对于其他类型的绘图会引发异常。希望在未来的版本中,能够有一种更统一的方式来获取 seaborn 绘图的“figure”对象。 - Salvatore Cosentino

网页内容由stack overflow 提供, 点击上面的
可以查看英文原文,
原文链接