使用SHAP值解释LogisticRegression分类。

3
我正在尝试使用SHAP对我的产品分类模型进行一些坏案例分析。我的数据看起来像这样:enter image description here
corpus_train, corpus_test, y_train, y_test = train_test_split(data['Name_Description'],
                                                              data['Category_Target'],
                                                              test_size = 0.2,
                                                              random_state=8)

vectorizer = TfidfVectorizer(stop_words='english', ngram_range=(1, 3), min_df=3, analyzer='word')

X_train = vectorizer.fit_transform(corpus_train)
X_test = vectorizer.transform(corpus_test)

model = LogisticRegression(max_iter=200)
model.fit(X_train, y_train)

X_train_sample = shap.sample(X_train, 100)
X_test_sample = shap.sample(X_test, 20)

masker = shap.maskers.Independent(data=X_test_sample)

explainer = shap.LinearExplainer(model, masker=masker)
shap_values = explainer.shap_values(X_test_sample)
X_test_array = X_test_sample.toarray()

shap.summary_plot(shap_values, X_test_array, feature_names=vectorizer.get_feature_names(), class_names=data['Category'].unique())

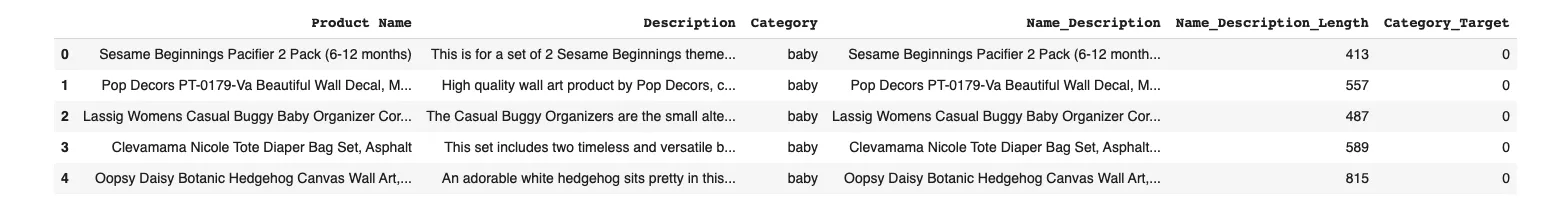
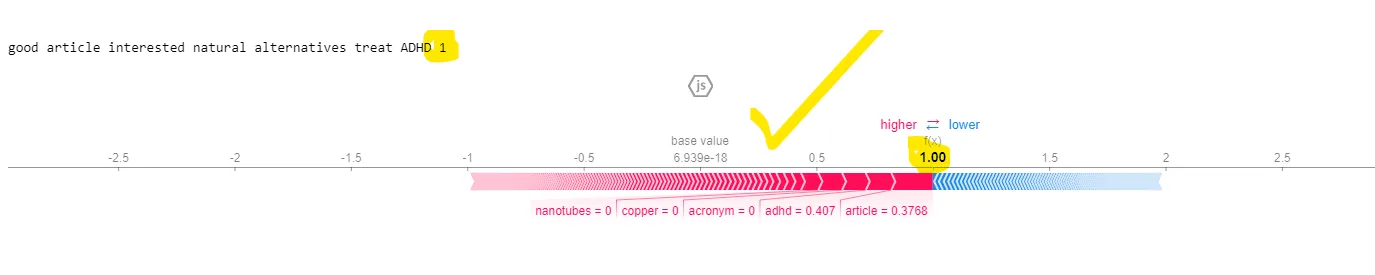
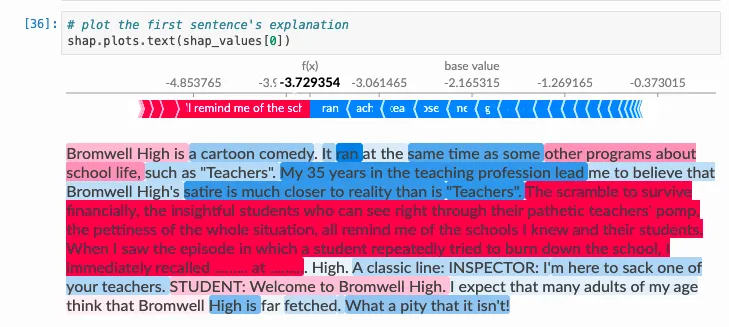
现在为了节省空间,我没有包含实际的摘要情节,但看起来还不错。我的问题是,我希望能够分析单个预测,并获得更接近以下内容的结果:

enter image description here

换句话说,我想知道哪些具体单词对预测起到了最大的贡献。但是当我在上面图片中的第36个单元格中运行代码时,我会得到一个…
AttributeError: 'numpy.ndarray' object has no attribute 'output_names'

我仍然对shap_values的索引感到困惑。我该如何解决这个问题?

2个回答

0

使用kernalSHAP,首先需要找到Shaply值,然后找到单个实例,如下所示:

#convert your training and testing data using the TF-IDF vectorizer
tfidf_vectorizer = TfidfVectorizer(use_idf=True)
tfidf_train = tfidf_vectorizer.fit_transform(IV_train) 
tfidf_test = tfidf_vectorizer.transform(IV_test)

model=LogisticRegression()
model.fit(tfidf_train, DV_train) 

#shap apply
#first shorten the data & convert to data frame

X_train_sample = tfidf_train[0:20]
sample_text = pd.DataFrame(X_test_sample)
 
SHAP_explainer = shap.KernelExplainer(model.predict, X_train_sample)
shap_vals = SHAP_explainer.shap_values(X_test_sample)

#print it.
print(df_test.iloc[7].Text , df_test.iloc[7].Label)
shap.initjs()
shap.force_plot(SHAP_explainer.expected_value, shap_vals[7,:],sample_text.iloc[7,:], feature_names=tfidf_vectorizer.get_feature_names_out())

enter image description here

原始文本为“好文章,介绍了治疗ADHD的天然替代方法”,标签为“1”


0
我在SHAP中找不到解决方案,但我在LIME中找到了一个解决方案。以下代码显示了非常相似的输出,在其中可以轻松地看到模型是如何进行预测以及某些单词对此的贡献。
c = make_pipeline(vectorizer, classifier)

# saving a list of strings version of the X_test object
ls_X_test= list(corpus_test)

# saving the class names in a dictionary to increase interpretability
class_names = list(data.Category.unique())

# Create the LIME explainer
# add the class names for interpretability
LIME_explainer = LimeTextExplainer(class_names=class_names)

# explain the chosen prediction 
# use the probability results of the logistic regression
# can also add num_features parameter to reduce the number of features explained
LIME_exp = LIME_explainer.explain_instance(ls_X_test[idx], c.predict_proba)
LIME_exp.show_in_notebook(text=True, predict_proba=True)

网页内容由stack overflow 提供, 点击上面的
可以查看英文原文,
原文链接