创建图例条目的想法是绘制多边形形状,然后将其添加到图例中。
因此,我们首先需要停用drawbounds,m.readshapefile(fn, 'shf', drawbounds = False)。然后我们可以从形状文件创建一个matplotlib.patches.Polygon并将其添加到轴上plt.gca().add_artist(polygon)。
然后可以使用该多边形更新图例。
handles, labels = plt.gca().get_legend_handles_labels()
handles.extend([polygon])
labels.extend(["Name of the shape"])
plt.legend(handles=handles, labels=labels)
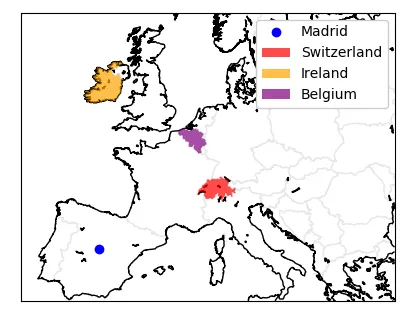
以下是一些示例代码,它会生成如下图像。它使用ne_10m_admin_0_countries文件。
from mpl_toolkits.basemap import Basemap
import matplotlib.pyplot as plt
from matplotlib.patches import Polygon
import numpy as np
m = Basemap(llcrnrlon=-10,llcrnrlat=35,urcrnrlon=35,urcrnrlat=60.,
resolution='i', projection='tmerc', lat_0 = 48.9, lon_0 = 15.3)
m.drawcoastlines()
m.drawcountries(zorder=0, color=(.9,.9,.9), linewidth=1)
fn = r"ne_10m_admin_0_countries\ne_10m_admin_0_countries"
m.readshapefile(fn, 'shf', drawbounds = False)
x,y = m([-3.703889],[40.4125])
m.plot(x,y, marker="o", color="blue", label="Madrid", ls="")
countries = ['Switzerland', 'Ireland', "Belgium"]
colors= {'Switzerland':"red", 'Ireland':"orange", 'Belgium' : "purple"}
shapes = {}
for info, shape in zip(m.shf_info, m.shf):
if info['NAME'] in countries:
p= Polygon(np.array(shape), True, facecolor= colors[info['NAME']],
edgecolor='none', alpha=0.7, zorder=2)
shapes.update({info['NAME'] : p})
for country in countries:
plt.gca().add_artist(shapes[country])
handles, labels = plt.gca().get_legend_handles_labels()
handles.extend([shapes[c] for c in countries])
labels.extend(countries)
plt.legend(handles=handles, labels=labels, framealpha=1.)
plt.show()
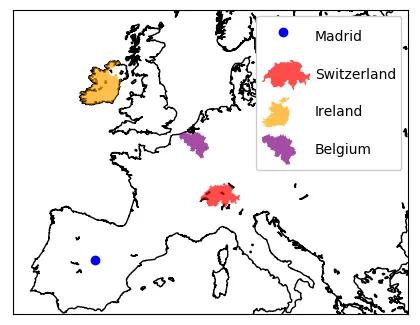
现在我们已经有了一个形状的多边形,为什么不将形状直接绘制到图例中,使其更加华丽。可以按如下方式完成。
from mpl_toolkits.basemap import Basemap
import matplotlib.pyplot as plt
from matplotlib.patches import Polygon
import numpy as np
m = Basemap(llcrnrlon=-10,llcrnrlat=35,urcrnrlon=35,urcrnrlat=60.,
resolution='i', projection='tmerc', lat_0 = 48.9, lon_0 = 15.3)
m.drawcoastlines()
fn = r"ne_10m_admin_0_countries\ne_10m_admin_0_countries"
m.readshapefile(fn, 'shf', drawbounds = False)
x,y = m([-3.703889],[40.4125])
m.plot(x,y, marker="o", color="blue", label="Madrid", ls="")
countries = ['Switzerland', 'Ireland', "Belgium"]
colors= {'Switzerland':"red", 'Ireland':"orange", 'Belgium' : "purple"}
shapes = {}
for info, shape in zip(m.shf_info, m.shf):
if info['NAME'] in countries:
p= Polygon(np.array(shape), True, facecolor= colors[info['NAME']],
edgecolor='none', alpha=0.7, zorder=2)
shapes.update({info['NAME'] : p})
for country in countries:
plt.gca().add_artist(shapes[country])
class PolygonN(object):
def legend_artist(self, legend, orig_handle, fontsize, handlebox):
x0, y0 = handlebox.xdescent, handlebox.ydescent
width, height = handlebox.width, handlebox.height
aspect= height/float(width)
verts = orig_handle.get_xy()
minx, miny = verts[:,0].min(), verts[:,1].min()
maxx, maxy = verts[:,0].max(), verts[:,1].max()
aspect= (maxy-miny)/float((maxx-minx))
nvx = (verts[:,0]-minx)*float(height)/aspect/(maxx-minx)-x0
nvy = (verts[:,1]-miny)*float(height)/(maxy-miny)-y0
p = Polygon(np.c_[nvx, nvy])
p.update_from(orig_handle)
p.set_transform(handlebox.get_transform())
handlebox.add_artist(p)
return p
handles, labels = plt.gca().get_legend_handles_labels()
handles.extend([shapes[c] for c in countries])
labels.extend(countries)
plt.legend(handles=handles, labels=labels, handleheight=3, handlelength=3, framealpha=1.,
handler_map={Polygon: PolygonN()} )
plt.show()
zorder确定图层绘制的顺序,zorder 越高,图层越靠上。就像桌子上的纸张一样-最下面的纸张具有最低的 zorder。但是,在这里没有使用它也没有什么理由,将其省略可以使形状呈现在海岸线的背后,这可能更好看。 - ImportanceOfBeingErnestshapely.geometry.Polygon创建一个descartes.patch.PolygonPatch。这个 patch 可以通过plt.gca().add_patch()添加到 matplotlib 画布中。但是我无法测试它,也不清楚它的好处是什么。 - ImportanceOfBeingErnest