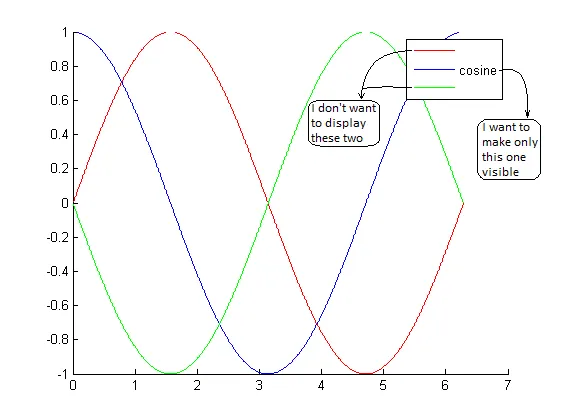
让我们从您的变量开始,然后绘制它们:
t = 0 : 0.01 : 2 * pi;
s = sin(t);
c = cos(t);
m = -sin(t);

figure;
hold ('all');
hs = plot(t, s);
hc = plot(t, c);
hm = plot(t, m);
有一个叫做IconDisplayStyle的属性。它被深深地埋藏了起来。你需要遵循以下路径:
Line -> Annotation -> LegendInformation -> IconDisplayStyle
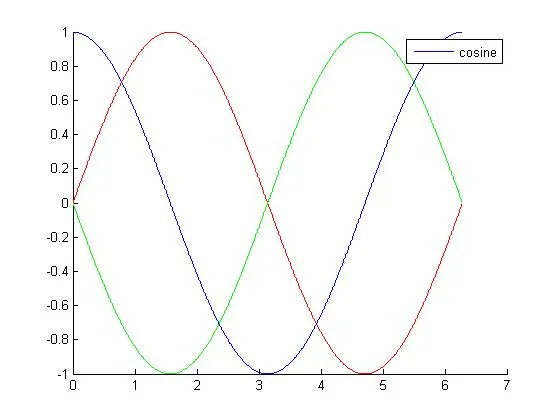
将IconDisplayStyle属性设置为off,将允许你跳过那条线。例如,我将关闭hs的图例。
hsAnno = get(hs, 'Annotation');
hsLegend = get(hsAnno, 'LegendInformation');
set(hsLegend, 'IconDisplayStyle', 'off');
当然,你可以这样继续做:
set(get(get(hs, 'Annotation'), 'LegendInformation'), 'IconDisplayStyle', 'off');
但我发现它更难理解。
现在,legend函数将只跳过hs。
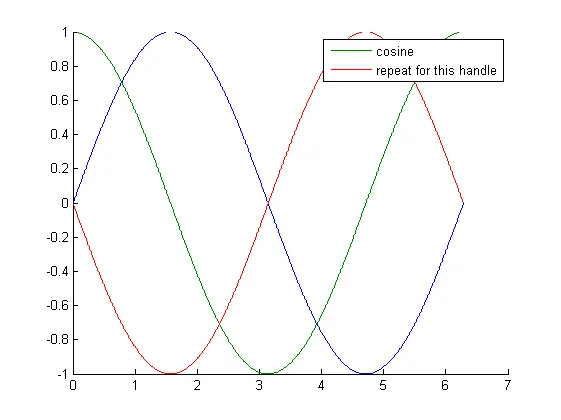
以此结束我的代码:
legend('cosine', 'repeat for this handle')
将会给你这个:
编辑: Jonas在评论中提出了一个不错的建议:
像这样设置hc的DisplayName属性:
set(hc, 'DisplayName', 'cosine');
legend(gca, 'show');
这将为您提供所需的图例。您将把您的线句柄与'cosine'关联起来。因此,您可以使用'off'或'show'参数直接调用图例。