调整base R中绘图标题和副标题

9
我如何让基础R绘图的标题和副标题效仿ggplot?我希望所有内容都靠左对齐,没有加粗字体,并且副标题直接位于标题下方。同时,我想让它们之间的间距稍微大一些。也许我的换行符“\n”是实现这一目标的最佳方式?
plot(mtcars)
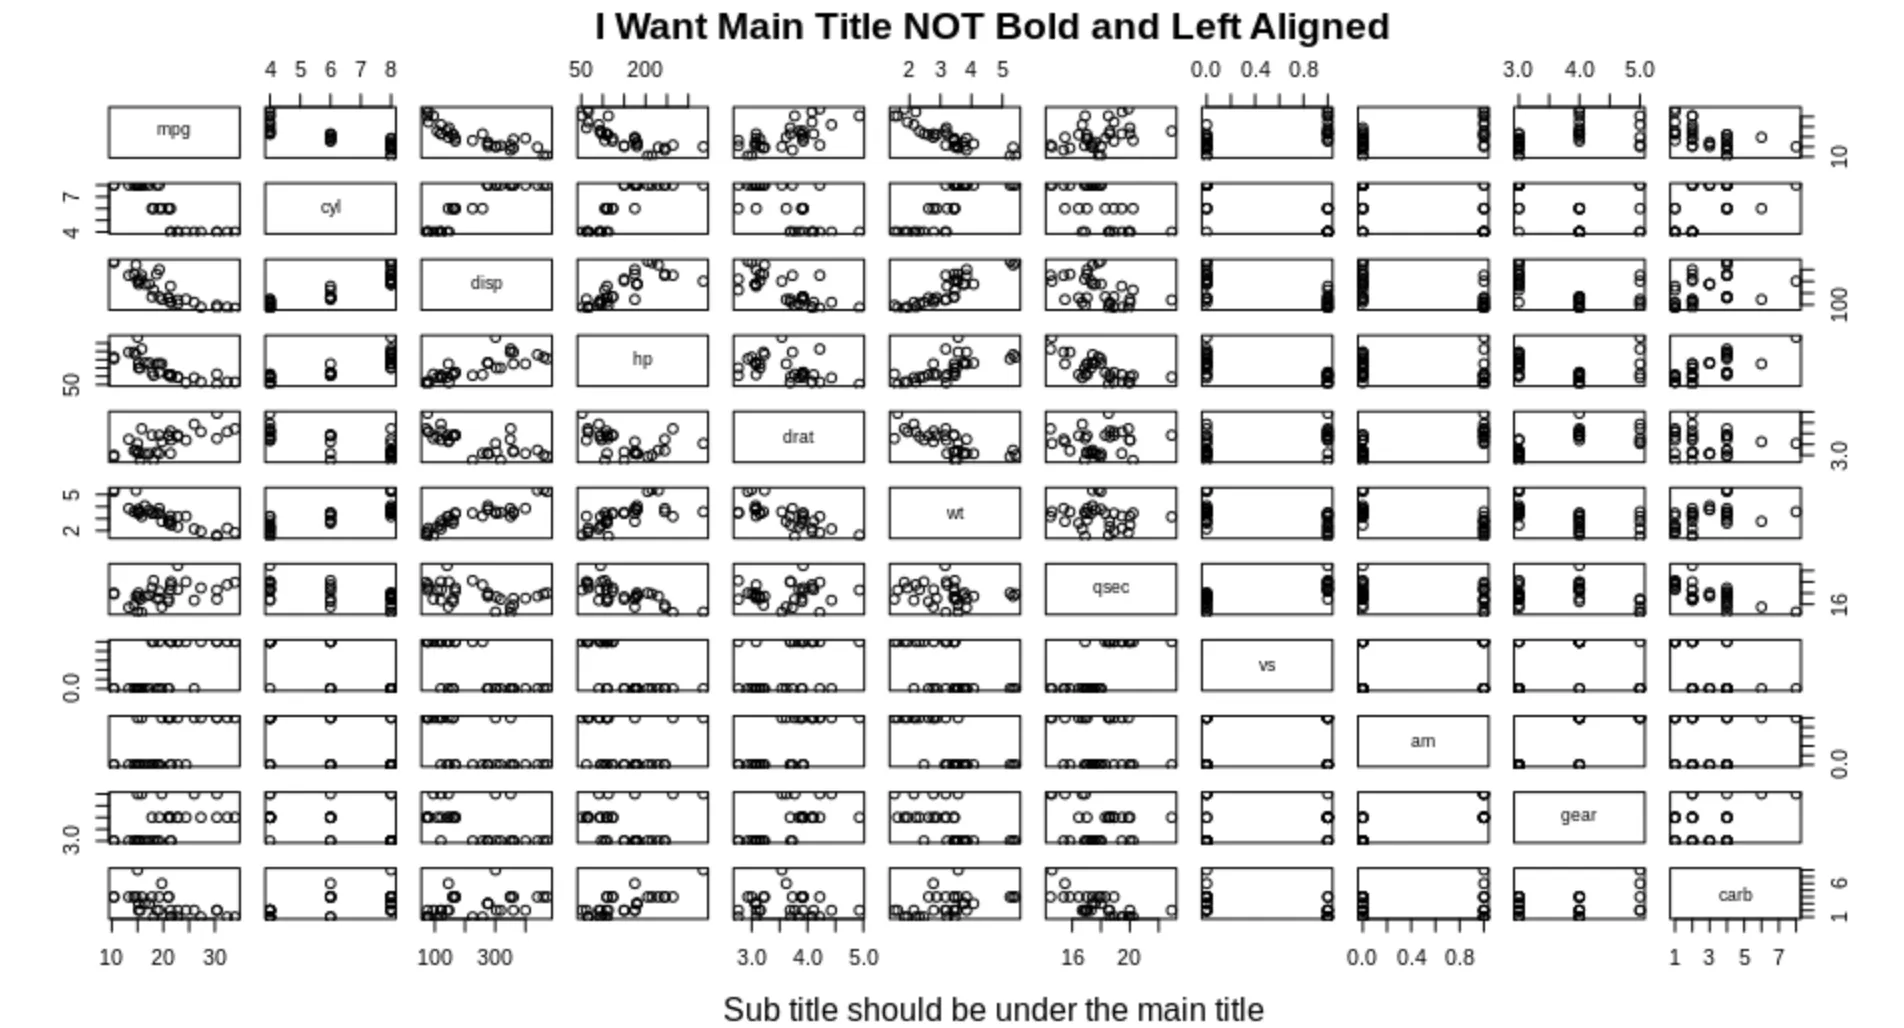
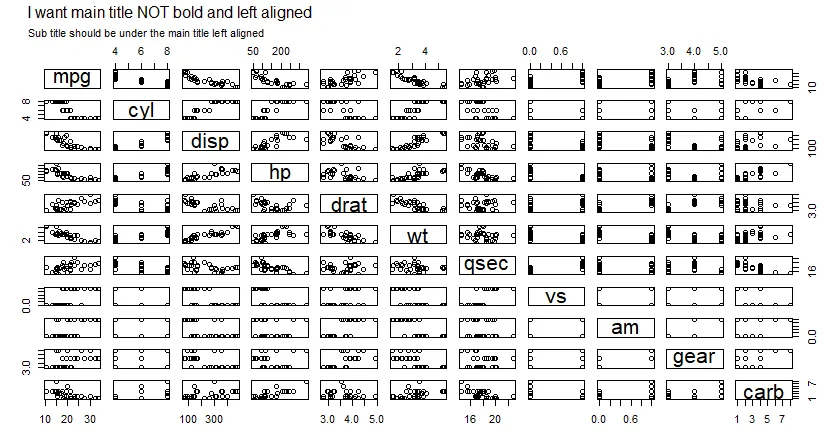
title(main = "I want main title NOT bold and left aligned\n\n", 
      sub = "Sub title should be under the main title left aligned")

r_titles


1
https://dev59.com/oGIj5IYBdhLWcg3wWT6c 和 https://www.r-bloggers.com/adding-text-to-r-plot/ 能够提供有用的信息。 - boski
2
也许 help(mtext) 会有帮助。 - Cettt
1个回答

19

根据Cettt的建议,使用mtext如下:

plot(mtcars, oma=c(2, 3, 5, 2))
mytitle = "I want main title NOT bold and left aligned"
mysubtitle = "Sub title should be under the main title left aligned"
mtext(side=3, line=3, at=-0.07, adj=0, cex=1, mytitle)
mtext(side=3, line=2, at=-0.07, adj=0, cex=0.7, mysubtitle)

adj=0选项要求左对齐。
line=选项定义每个标题的垂直位置,从绘图顶部边框向外计数。
您可以通过调整at=选项来水平移动标题。

还请注意在plot()调用中使用oma=选项,以便有足够的空间将标题放置在成对的绘图上方。

这是绘图: enter image description here


网页内容由stack overflow 提供, 点击上面的
可以查看英文原文,
原文链接