带有伽马参数的渐变色比例尺?

3
我有一些成像数据,对比度非常微弱且噪声很多,当我使用线性颜色比例显示时效果不好。在像imageJ或photoshop这样的成像软件中,有一个色调曲线可以调整,以非线性方式提高对比度并有效地拉伸感兴趣区域的比例尺以查看更多细节。
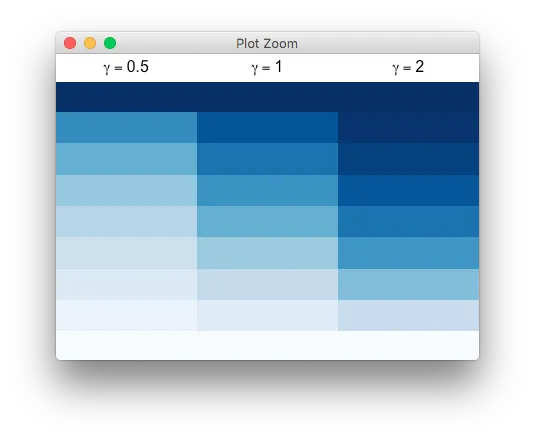
作为这种非线性调整参数的最简单情况,@BrianDiggs指出了colorRamp的偏差参数,但仍需要先将数据转换为[0,1]范围内。 我想将非线性比例尺推广到除x^gamma之外的其他函数,因此下面的函数实际上不使用colorRamp中的偏差参数,而是在数据方面进行转换。
我觉得我正在重新发明轮子; 在R中是否已经有这样的连续色彩比例尺工具?
1个回答

0

这里是一个可能的解决方案,

set.seed(123)
x <- sort(runif(1e4, min=-20 , max=120))

library(scales) # rescale function

curve_pal <- function (x, colours = rev(blues9), 
                       fun = function(x) x^gamma,
                       n=10, gamma=1) 
{
    # function that maps [0,1] -> colours
    palfun <- colorRamp(colors=colours)

    # now divide the data in n equi-spaced regions, mapped linearly to [0,1]
    xcuts <- cut(x, breaks=seq(min(x), max(x), length=n))
    xnum <- as.numeric(xcuts)

    # need to work around NA values that make colorRamp/rgb choke
    testNA <- is.na(xnum)
    xsanitised <- ifelse(testNA, 0, fun(rescale(xnum))) 

    # non-NA values in [0,1] get assigned their colour
    ifelse(testNA, NA, rgb(palfun(xsanitised), maxColorValue=255))
}

library(gridExtra)
grid.newpage()
grid.arrange(rasterGrob(curve_pal(x, gamma=0.5), wid=1, heig=1, int=F),
             rasterGrob(curve_pal(x, gamma=1), wid=1, heig=1, int=F), 
             rasterGrob(curve_pal(x, gamma=2), wid=1, heig=1, int=F), 
             nrow=1)

enter image description here


网页内容由stack overflow 提供, 点击上面的
可以查看英文原文,
原文链接