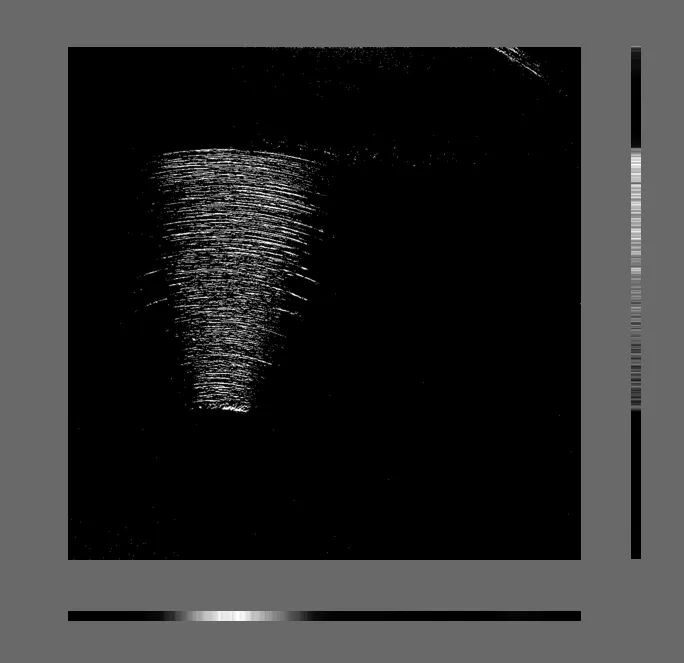
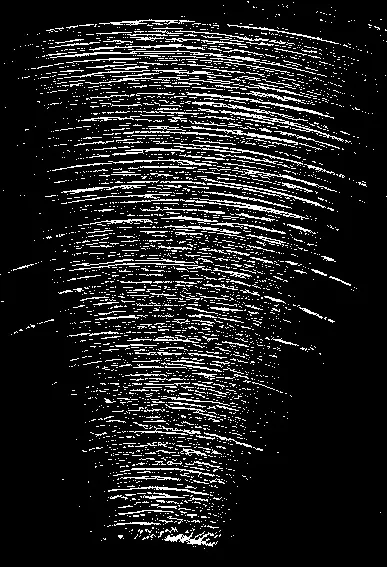
我想裁剪出一张图像中充满小曲线的区域。
原始图像如下所示: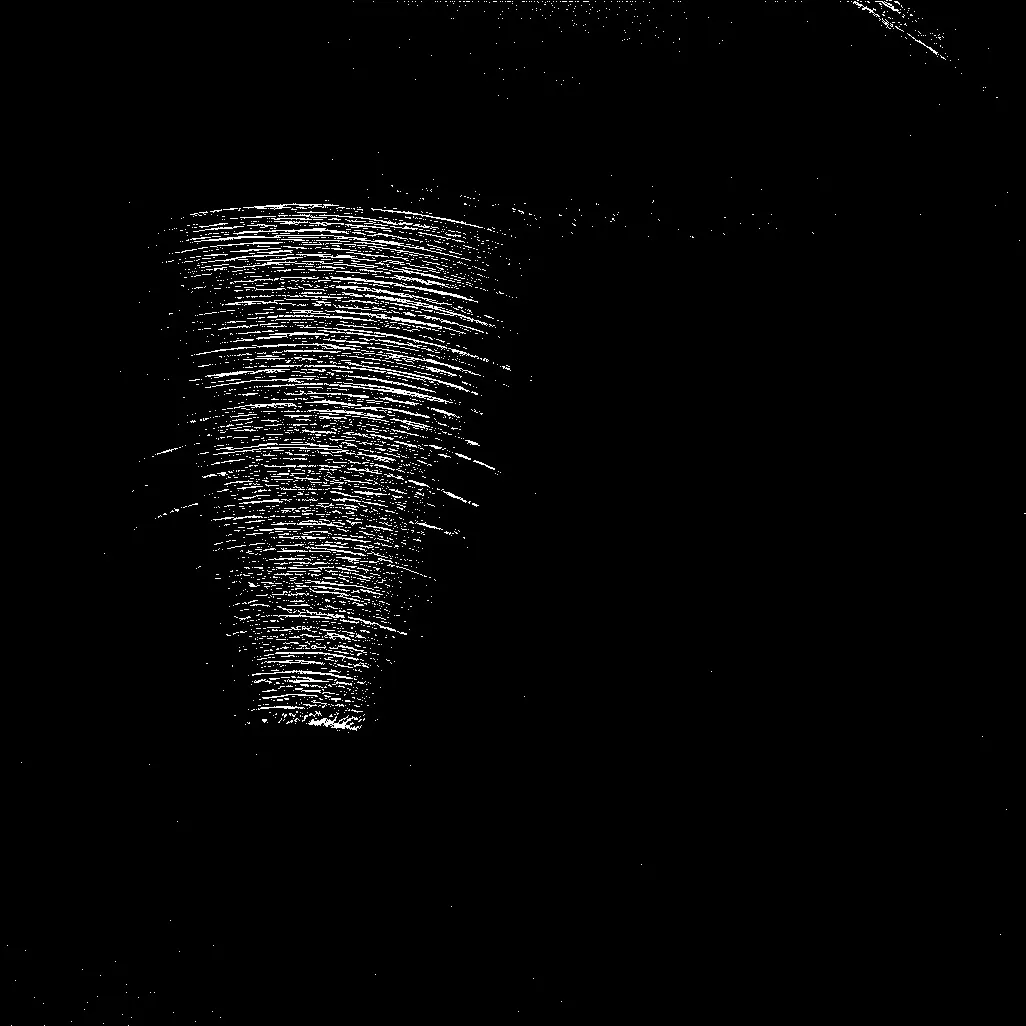 使用“开运算”可以去除大部分噪点。结果如下:
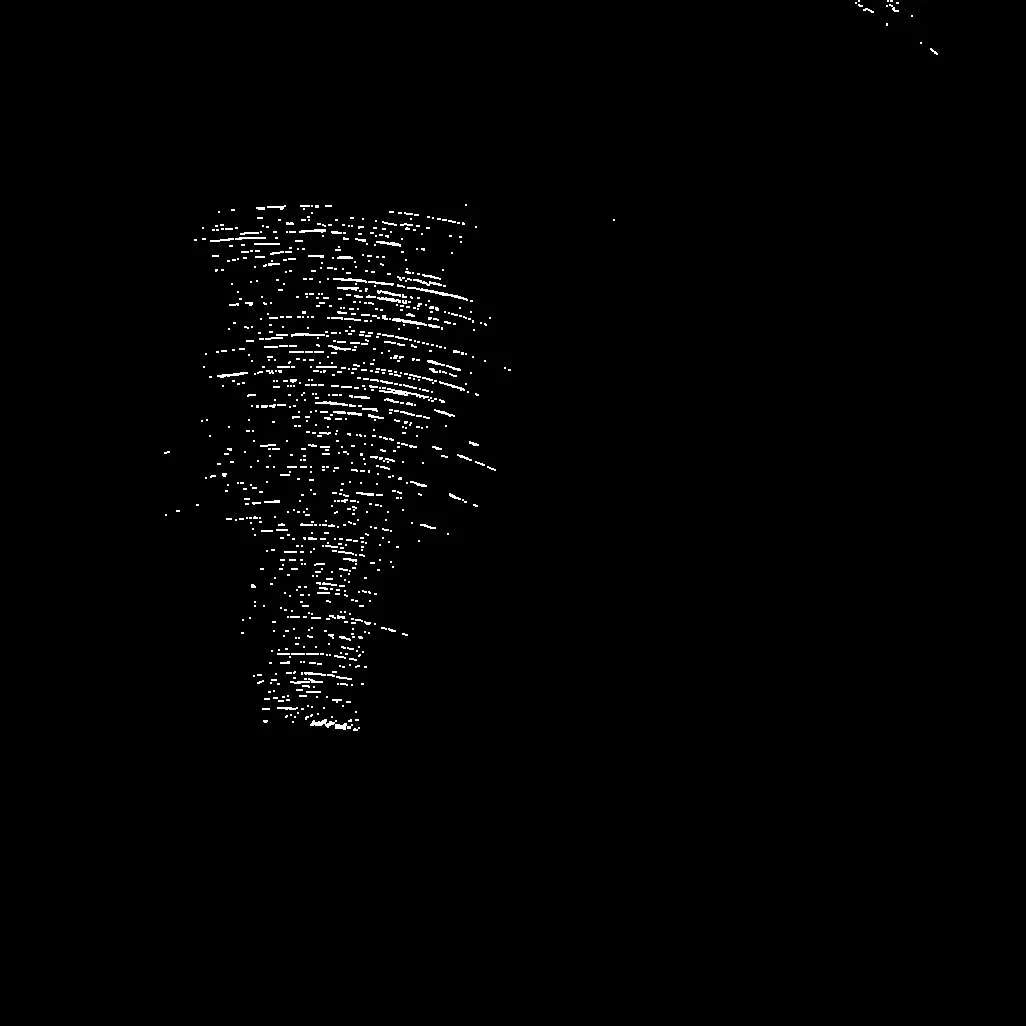 我尝试使用“膨胀”来连接我所需区域中的这些像素,但结果并不理想。
在opencv中是否有任何可以定位此区域的功能?
原始图像如下所示:
使用“开运算”可以去除大部分噪点。结果如下:
我尝试使用“膨胀”来连接我所需区域中的这些像素,但结果并不理想。在opencv中是否有任何可以定位此区域的功能?
使用“开运算”可以去除大部分噪点。结果如下:
我尝试使用“膨胀”来连接我所需区域中的这些像素,但结果并不理想。你走在正确的道路上,以下是使用形态学变换的一种方法:
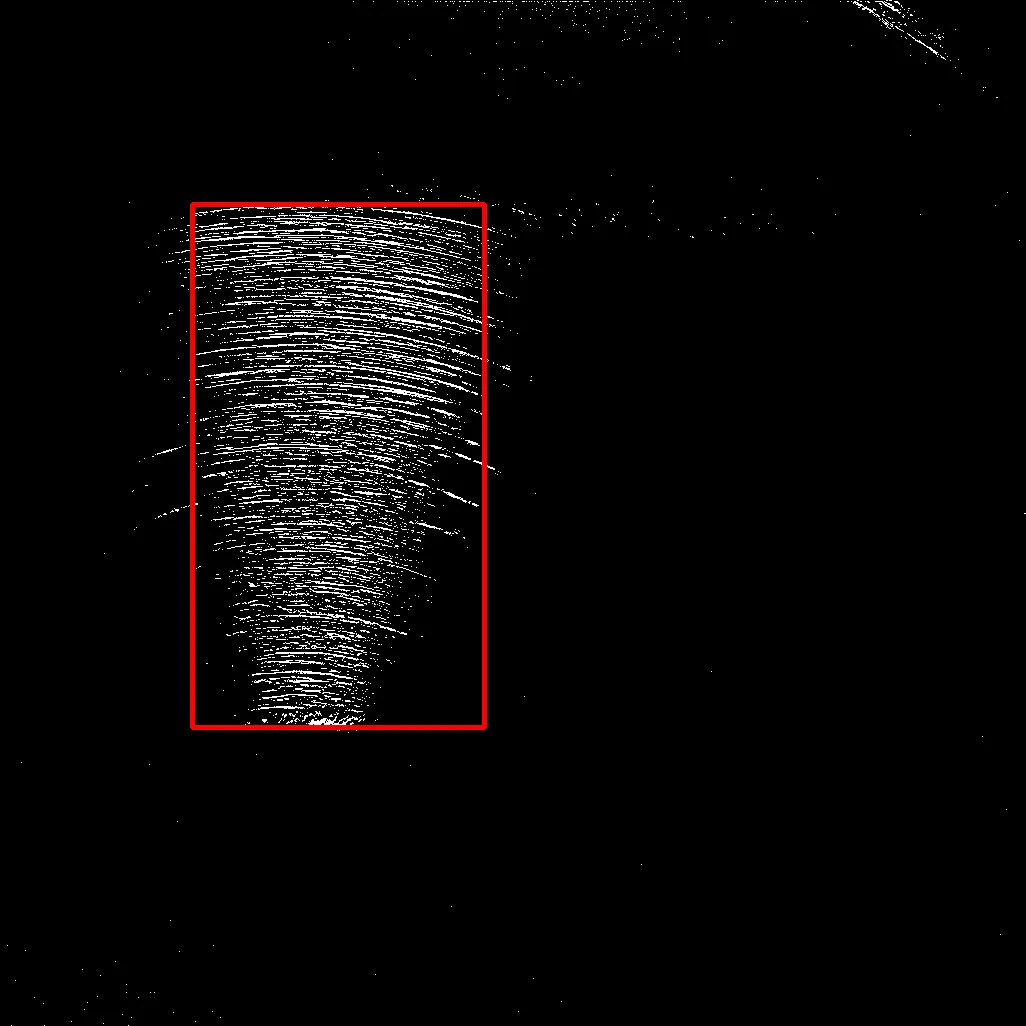
思路是将所需区域连接成一个单一的轮廓,然后使用最大面积进行筛选。这样,我们就可以将该区域作为一个整体抓取。以下是检测到的区域:
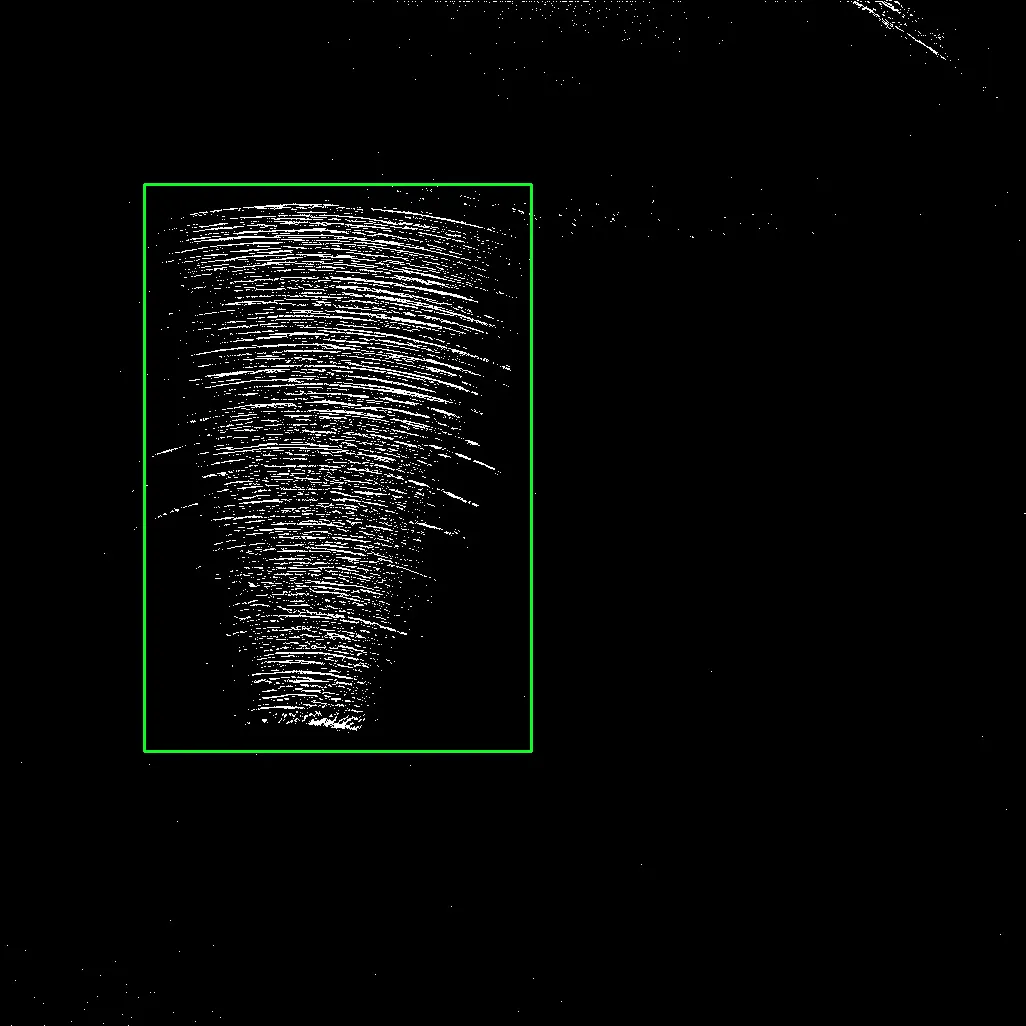
随后,我们可以使用Numpy切片提取该区域。
import cv2

image = cv2.imread('1.jpg')
original = image.copy()
gray = cv2.cvtColor(image, cv2.COLOR_BGR2GRAY)
blur = cv2.GaussianBlur(gray, (9,9), 0)
thresh = cv2.threshold(gray,0,255,cv2.THRESH_OTSU + cv2.THRESH_BINARY)[1]

kernel = cv2.getStructuringElement(cv2.MORPH_RECT, (2,2))
opening = cv2.morphologyEx(thresh, cv2.MORPH_OPEN, kernel)
dilate_kernel = cv2.getStructuringElement(cv2.MORPH_RECT, (9,9))
dilate = cv2.dilate(opening, dilate_kernel, iterations=5)

cnts = cv2.findContours(dilate, cv2.RETR_EXTERNAL, cv2.CHAIN_APPROX_SIMPLE)
cnts = cnts[0] if len(cnts) == 2 else cnts[1]
cnts = sorted(cnts, key=cv2.contourArea, reverse=True)

for c in cnts:
    x,y,w,h = cv2.boundingRect(c)
    cv2.rectangle(image, (x, y), (x + w, y + h), (36,255,12), 2)
    ROI = original[y:y+h, x:x+w]
    break

cv2.imshow('thresh', thresh)
cv2.imshow('opening', opening)
cv2.imshow('dilate', dilate)
cv2.imshow('image', image)
cv2.imshow('ROI', ROI)
cv2.waitKey(0)
sum函数的方法。只需分别对x和y轴上的像素值求和,设置一些描述所需区域最小像素数量的阈值,并获得适当的列和行索引。import cv2
import numpy as np
from matplotlib import pyplot as plt
# Read input image; get shape
img = cv2.imread('images/UKf5Z.jpg', cv2.IMREAD_GRAYSCALE)
w, h = img.shape[0:2]
# Threshold to prevent JPG artifacts
_, img = cv2.threshold(img, 240, 255, cv2.THRESH_BINARY)
# Sum pixels along x and y axis
xSum = np.sum(img / 255, axis=0)
ySum = np.sum(img / 255, axis=1)
# Visualize curves
plt.plot(xSum)
plt.plot(ySum)
plt.show()
# Set up thresholds
xThr = 15
yThr = 15
# Find proper row indices
tmp = np.argwhere(xSum > xThr)
tmp = tmp[np.where((tmp > 20) & (tmp < w - 20))]
x1 = tmp[0]
x2 = tmp[-1]
# Find proper column indices
tmp = np.argwhere(ySum > yThr)
tmp = tmp[np.where((tmp > 20) & (tmp < h - 20))]
y1 = tmp[0]
y2 = tmp[-1]
# Visualize result
out = cv2.cvtColor(img, cv2.COLOR_GRAY2BGR)
cv2.rectangle(out, (x1, y1), (x2, y2), (0, 0, 255), 4)
cv2.imshow('out', out)
cv2.waitKey(0)
总和曲线看起来像这样(仅用于可视化目的):
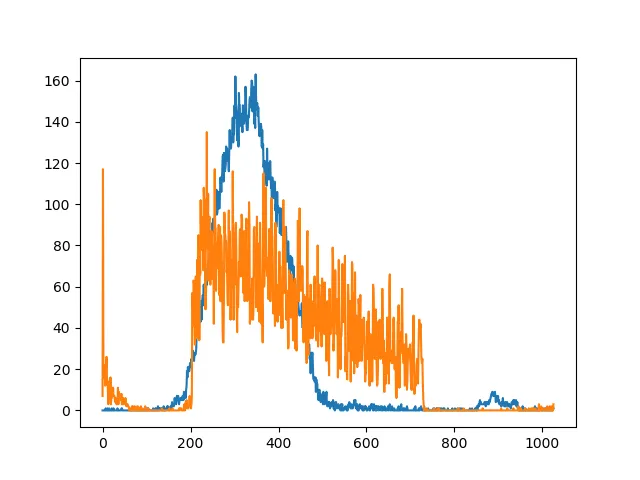
为了可视化,我只是绘制了一个由找到的索引描述的红色矩形。
编辑:如Mark在他的回答中所建议的,使用mean而不是sum可以避免因图像尺寸不同而需要进行调整。适当更改代码留给读者自行处理。 :-)
与 @HansHirse 的优秀回答相同的思路,但我制作了一张图表,无法在评论中分享。