C3图表中的工具提示未刷新

3
我们在一个实时数据环境中使用c3图表库的条形图功能。这导致了一个问题,即如果用户悬停在一个条形图上,条形图本身会更新,但是显示的工具提示却没有更新。有没有一种方法可以更新/重新加载工具提示?
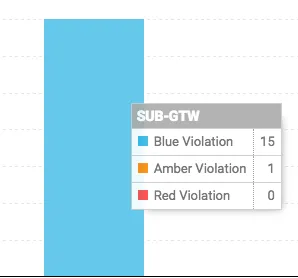
enter image description here @更新1: 抱歉回复晚了。基本上,我们有一个观察者监听数据变化。这将触发一个名为reload的方法,其中包含以下行(数据的外观如评论中所示):
chart.load({
            xs: xs, // AmberViolation:"facilityId",BlueViolation:"facilityId",RedViolation:"facilityId"
            columns: columns, // [["facilityId", "SUB-GTW"],["RedViolation", 0],["BlueViolation", 2],["AmberViolation", 0]]
                    unload: _.difference(drawnChartYCols, nextDrawColumns),
            types: types, // AmberViolation:"bar",BlueViolation:"bar",RedViolation:"bar"
            colors: colors,
            done: function () {
                if (columns.length && columns[0].length > 10) {
                    chart.zoom([0, 11]);
                    d3.select(element[0]).selectAll('svg > g').filter(function(d, i) { return i === 1 }).attr('display', null);
                    chart.resize({width: $scope.width, height: $scope.height});
                            d3.select(element[0]).select('.extent').attr('x', 0);
                } else {
                    chart.unzoom();
                    d3.select(element[0]).selectAll('svg > g').filter(function(d, i) { return i === 1 }).attr('display', 'none');
                    chart.resize({width: $scope.width, height: $scope.height + 70});
                }
            }
});
chart.groups([groups]);// ["RedViolation","BlueViolation","AmberViolation"]

@更新2:

您甚至可以在http://c3js.org/samples/chart_bar_stacked.html上看到这种行为。 只要在数据更新时悬停在其中一个条形图上并让鼠标停留在那里,工具提示就不会更新。 只有再次移动鼠标才会刷新。enter image description here

@更新3:由于即使在我创建的c3图表示例中也会出现此问题,因此我在Github上创建了一个错误报告:https://github.com/c3js/c3/issues/2307


你在图表上使用 .load(args) 函数来加载新数据吗?http://c3js.org/reference.html#api-load - Andrew Lohr
是的,我们使用 chart.load 并使用它更新 xs、columns、unload、types 和 colors。 - Hendrik
如果您在问题描述中提供了一个最小化、完整和可验证的示例,那么您可能会得到更多的帮助。请参考以下链接以获取更多信息:https://stackoverflow.com/help/mcve - Andrew Lohr
请查看http://c3js.org/samples/chart_bar_stacked.html,当数据更新时将鼠标悬停在其中一个条形图上并让鼠标保持在那里。您会发现工具提示不会更新。 - Hendrik
2个回答

0

你没有提供任何代码片段,所以很难回答。我猜想你没有正确更新数据。根据文档:

如果你在卸载之前/之后立即调用load API,则应该使用load的卸载参数。否则,由于取消动画,图表将无法正确渲染。

像这样卸载旧值的做法可能会解决你的问题:

chart.load({
  unload: true,
  columns: ['data1', 100]
});

看看这个 SO 上的 之前的回答


嗨,感谢您的回复。我尝试使用unload:true来检查,但这也没有导致工具提示被隐藏。 - Hendrik
我曾经遇到过类似的问题,即使我调用了un/load(),数据仍然没有被加载或卸载,这可能是c3js的一个bug。请参见https://github.com/c3js/c3/issues/975 你可以尝试使用flush()resize(并保持unload=true)。 如果你的使用方式允许,也许删除图表并使用chart.generate()而不是chart.load重新创建它可以解决问题... - Sala

0

我的当前解决方案是在数据更新后隐藏和显示工具提示以刷新它。这很丑陋,因为用户可以看到工具提示位置的跳动。

var currentIndex = null;
var chart = c3.generate({
    data: {
        columns: [
            ['data1', 20],
            ['data2', 30],
            ['data3', 40]
        ],
        type: 'bar',
        groups: [
            ['data1', 'data2', 'data3']
        ],
        onmouseover: function(e) {
          currentIndex = e.index;
    },
        onmouseout: function(e) {
         currentIndex = null;
        }
    },
    axis: {
       y: {
        show: true,
       },
       x: {
        show: true,
        type: ({
         NUMERIC: 'indexed',
         TEXT: 'category',
         DATE: 'timeseries'
        })['TEXT']
       }
      },
      bar: {
       width: {
        ratio: 0.9,
        max: 100
       }
      },
      padding: {
       top: 25,
       right: 25
      },
      zoom: {enabled: false},
      subchart: {
       show: true,
       axis: {
        x: {
         show: false
        }
       }
      },
      legend: {
       show: false
      },
      line: {
       connectNull: true
      },
      transition: {
       duration: null
      },
      grid: {
       y: {
        show: true
       }
      }
});

setTimeout(function () {
    chart.load({
        columns: [['data1', 30],
            ['data2', 10],
            ['data3', 10]]
    });
    
    if (currentIndex != null) {
     chart.tooltip.hide();
     chart.tooltip.show({x: currentIndex});
    }
    
}, 3000);
<link href="https://rawgit.com/masayuki0812/c3/master/c3.css" rel="stylesheet"/>
<script src="https://rawgit.com/masayuki0812/c3/master/c3.js"></script>
<script src="https://cdnjs.cloudflare.com/ajax/libs/d3/3.4.11/d3.min.js"></script>
<div id="chart"></div>

我添加了一个hover监听器,在那里我获取当前的currentHoverIndex,并添加了一个onmouseout监听器来将currentHoverIndex设置为null,以便在用户此时不悬停在柱形图上时不会意外显示工具提示。

网页内容由stack overflow 提供, 点击上面的
可以查看英文原文,
原文链接