我有一个向量,其中包含
temp <- c("hyndman_ensemble","four_theta","tbats")
当我打印temp时,four_theta和tbats之间会出现未知的空格(在R控制台中尝试此操作)。
[1] "hyndman_ensemble" "four_theta" "tbats"
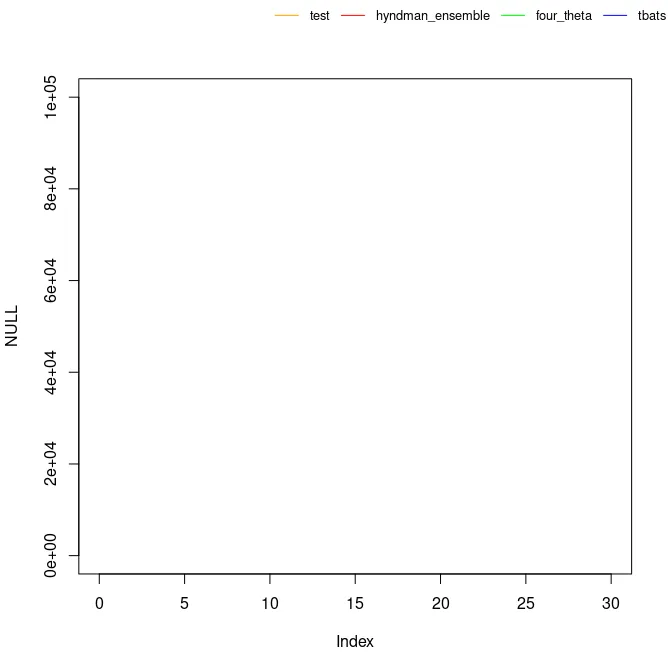
我正在将这个临时变量用于图例中。由此导致的问题是图例会出现空格,如果列表中有5个项目,则数据会遗漏。
Legend_function:
add_legend <- function(...) {
opar <- par(fig=c(0, 1, 0, 1), oma=c(0, 0, 0, 0),
mar=c(0, 0, 0, 0), new=TRUE)
on.exit(par(opar))
plot(0, 0, type='n', bty='n', xaxt='n', yaxt='n')
legend(...)
}
cl <- rainbow(3)
#Null plot just to display what is happening with the spaces in legend
plot(NULL, xlim=c(0,30), ylim=c(0,100000))
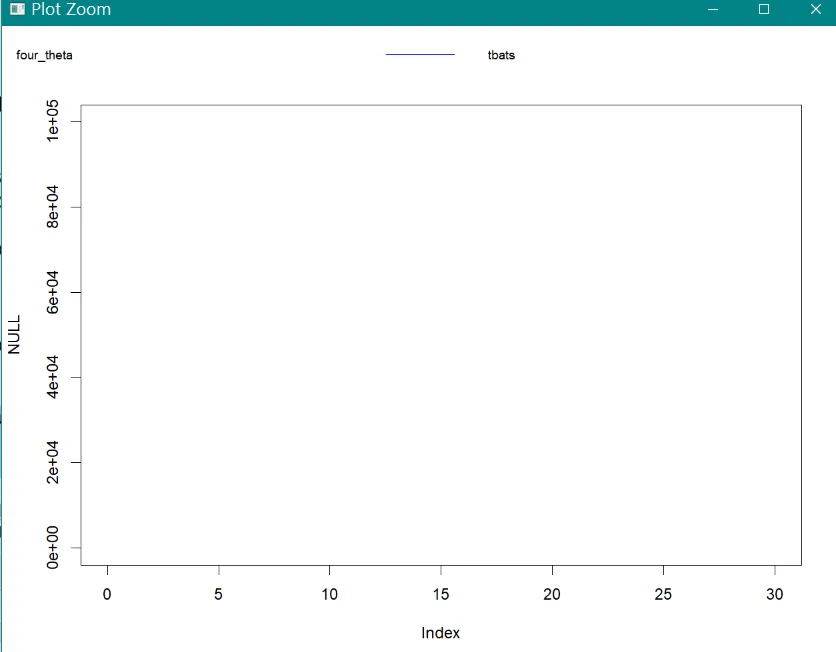
add_legend("topright", legend=c("test1",temp), lty=1,
col=c("orange", cl),
horiz=TRUE, bty='n', cex=0.8)
这是图表的样子。
 即使我使用trimws(),也会得到空格(见图片)。
有人能告诉我如何去掉这些空格或任何其他替代方法,以便我可以在不留空格的情况下在图表外打印图例(图例不一定要在顶部)。
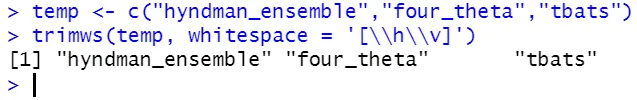
cat(temp)来查看此内容) - user10917479trimws(temp, whitespace = '[\\h\\v]')[1] "hyndman_ensemble" "four_theta" "tbats",正如@Adam所说。那么现在怎么办? - Chris[1] "hyndman_ensemble" "four_theta" "tbats",更糟糕的是 swapped <- c('tbats', 'four_theta', 'hyndman_ensamble')[1] "tbats" "four_theta" "hyndman_ensamble"。我现在只能跟进并等待更聪明的人发表意见,因为很难看出“不存在的东西”如何传播到图形。 - Chrisc("a", "b", "c", "d"),然后输入c("aaa", "b", "c", "d"),再输入c("aaaaaaaaaa", "b", "c", "d")来查看这一点。通常情况下,这是很好的,因为当向量足够长以至于需要跨多行时,它有助于对齐。legend函数在选择间距时也有类似的行为。但改变其中一个不会改变另一个——它们只是碰巧做了同样的事情。 - Gregor Thomas