我有一个pandas数据帧,其中包含一个布尔列,如下所示:
| A | B |   C   |
| 1 | 3 | True  |
| 2 | 4 | True  |
| 3 | 4 | False |
| 4 | 1 | False |
| 5 | 2 | True  |
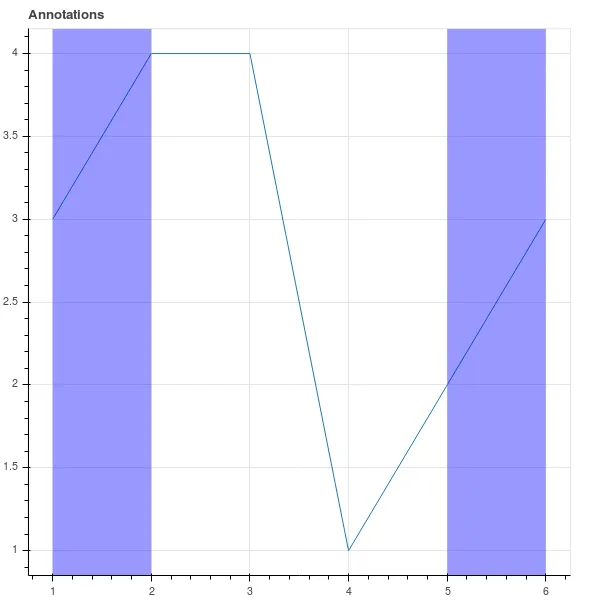
我希望您能在y轴上绘制B的值,在x轴上绘制A的值,并且根据C的条件背景色进行条件性着色。我希望效果类似于下面的图片:
我可以使用框注释实现这个吗?
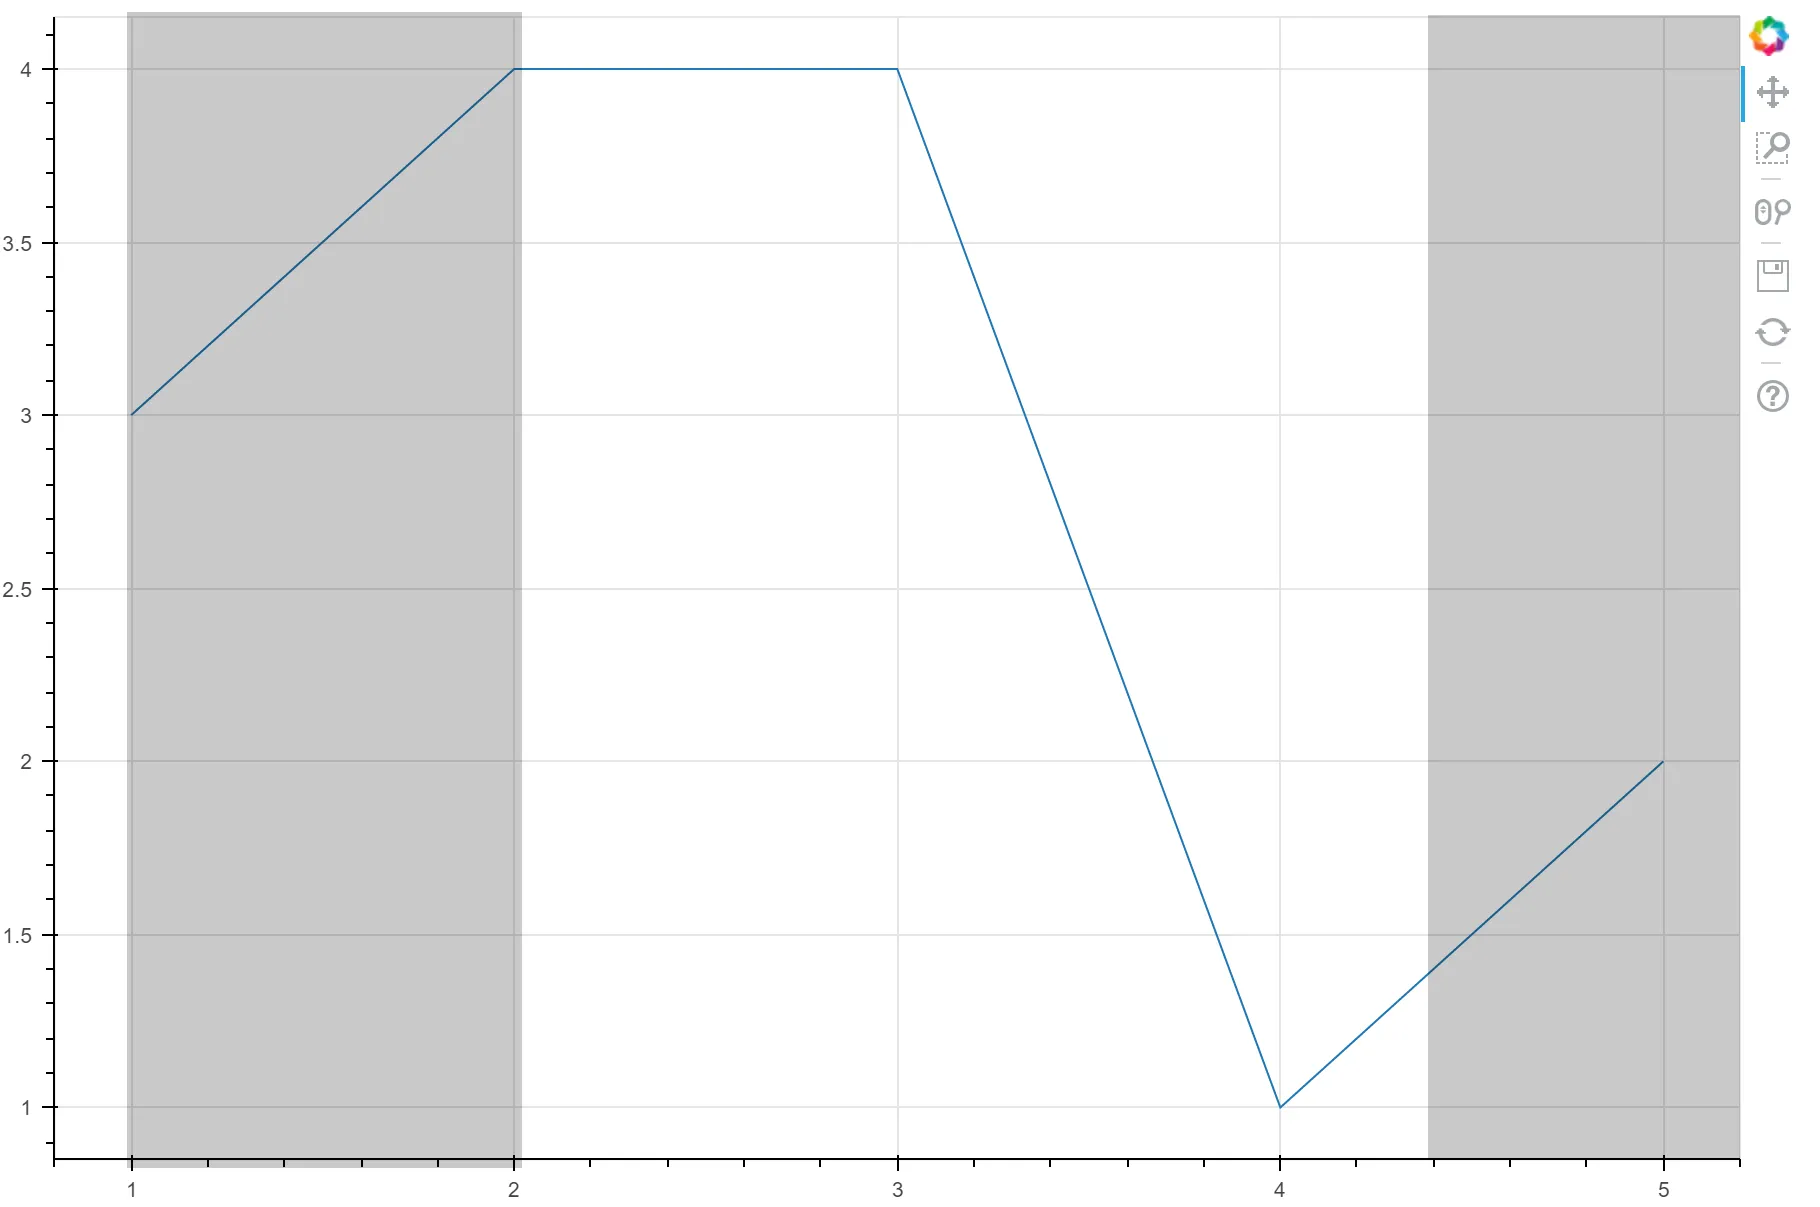
是的,可以使用BoxAnnotation的left和right参数来实现:
import pandas as pd
from bokeh.plotting import figure, show, output_file, output_notebook
from bokeh.models import BoxAnnotation

output_notebook()

# dummy data
df = pd.DataFrame({"A": [1, 2, 3, 4, 5, 6],
                   "B": [3, 4, 4, 1, 2, 3],
                   "C": [True, True, False, False, True, True]})
print(df)

>>>     A   B   C

    0   1   3   True
    1   2   4   True
    2   3   4   False
    3   4   1   False
    4   5   2   True
    5   6   3   True
True计数。True的连续行:df["cons"] = (df["C"].diff(1) != 0).astype('int').cumsum()
mask = df["cons"] % 2 == 1
cons_indices = df[mask].groupby("cons").apply(lambda x: x.A.values)
print(cons_indices)
>>> cons
1 [1, 2]
3 [5, 6]
dtype: object
p = figure(title="Annotations")
p.line(df["A"], df["B"])

for cons_index in cons_indices:
    low_box = BoxAnnotation(left=cons_index.min(), right=cons_index.max(), fill_color="Blue")
    p.add_layout(low_box)

show(p)
True值(非连续的True)。但是,您还没有为此情况指定适当的行为。