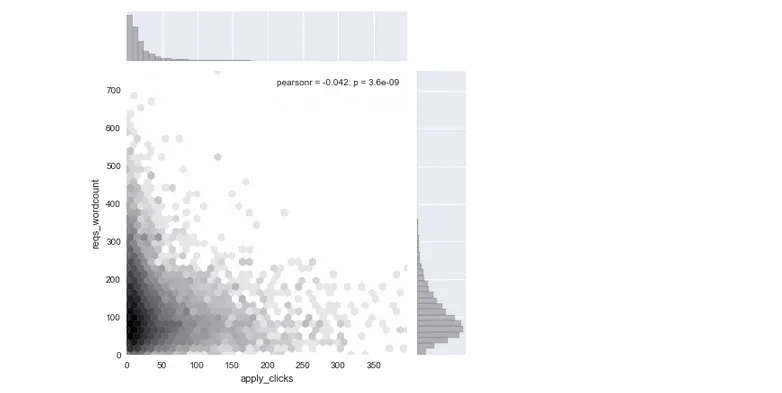
我终于成功地将我的六角形分布图整理成了一些几乎漂亮的东西。
import seaborn as sns

x = req.apply_clicks
y = req.reqs_wordcount

sns.jointplot(x, y, kind="hex", color="#5d5d60",
         joint_kws={'gridsize':40, 'bins':'log'})
但我希望在上面叠加一个回归线,但是我不知道该如何实现。例如,当我在代码中添加regplot时,回归线似乎占据了边际图:
x = req.apply_clicks
y = req.reqs_wordcount
z = sns.jointplot(x, y, kind="hex", color="#5d5d60",
         joint_kws={'gridsize':40, 'bins':'log'})
sns.regplot(x, y, data=z, color="#5d5d60", scatter=False)
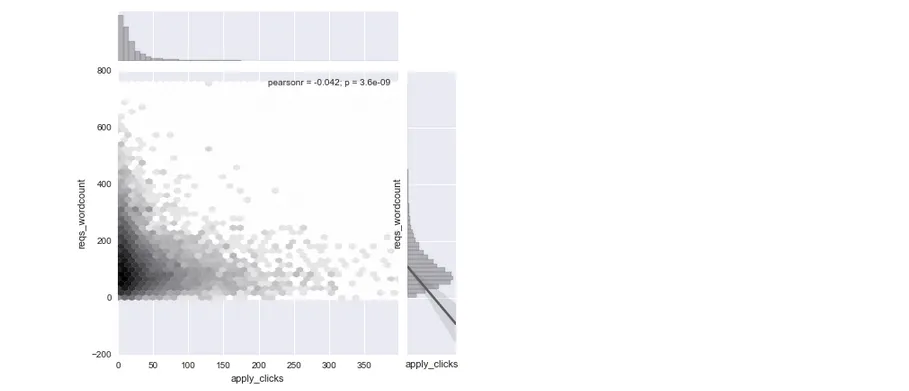
如何在图表正文中包含回归线?
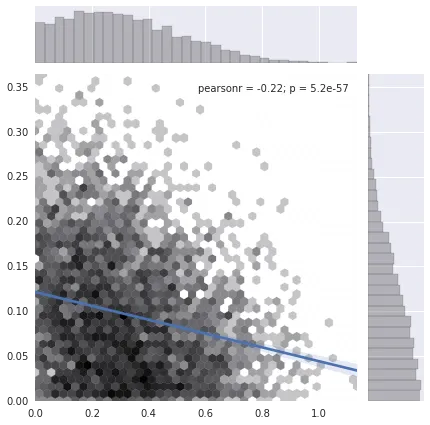
regplot并将scatter=False。 - mwaskom