在R中绘制具有不同x轴的2条线

3
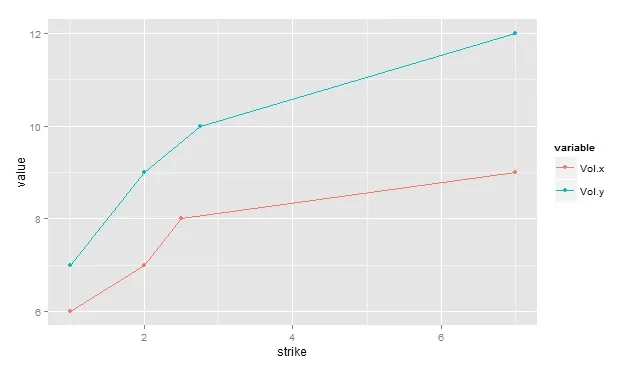
我有两个数据框x和y需要合并。然后我想绘制两条线:line 1=来自x数据框的"vol",line 2=来自y数据框的"vol"。这两条线都应该在x轴上标有"strike"。我遇到了一些错误,我认为这是因为x轴不同。你能帮忙吗?我真的很想使用ggplot。以下是可供运行的代码:
x<- data.frame(strike= c(1,2,2.5,7), term= c("H15"), Vol = c(6,7,8,9), file="a")
x
y<- data.frame(strike= c(1,2,2.75,7), term=c("H15"), Vol = c(7,9,10,12),file="b")
y
main<- merge(x,y, by = "strike", all= TRUE)
main

strikes<- factor(main$strike,levels=c(main$strike),ordered=TRUE)
strikes

stacked <- data.frame(time=strikes, value =c(c(x$Vol), c(y$Vol)) , variable =   rep(c("a","b"), each=NROW(x[,1])))  
stacked

MyPlot<- ggplot(stacked, aes( x = time,  y=value, colour=variable, group= variable)  )   +   geom_line()  
MyPlot

1
提供的示例代码存在一些问题 - stacked 对象具有不同大小的向量,因此无法绑定到数据框中。请验证一下。 - sriramn
这就是问题所在... - user3022875
哎呀...我以为这只是一个情节问题。 - sriramn
1个回答

2
你可以使用 reshape2ggplot2 完成这个任务:
首先,让我们将你的数据进行整理:
library(reshape2)
x.melt<-melt(x[,c("strike", "Vol")], id="strike")
y.melt<-melt(y[,c("strike", "Vol")], id="strike")
x.melt[, "variable"] <-"Vol.x"
y.melt[, "variable"] <-"Vol.y"
data <- rbind(x.melt, y.melt)

通过这个,我们拥有了:

  strike variable value
1   1.00    Vol.x     6
2   2.00    Vol.x     7
3   2.50    Vol.x     8
4   7.00    Vol.x     9
5   1.00    Vol.y     7
6   2.00    Vol.y     9
7   2.75    Vol.y    10
8   7.00    Vol.y    12

现在我们可以将其与ggplot2一起使用:
library(ggplot2)
ggplot(data, aes(x=strike,  y=value, colour=variable))   +  geom_point()+ geom_line() 

结果如下所示:

enter image description here


网页内容由stack overflow 提供, 点击上面的
可以查看英文原文,
原文链接