我制作了一个类似于这篇文章的环形图表:https://medium.com/@pppped/how-to-code-a-responsive-circular-percentage-chart-with-svg-and-css-3632f8cd7705。但是,我也尝试在其中显示超过100%的值(该图表显示本月消费与上月消费的比较,有时需要显示值大于100%的情况)。我尝试添加另一个圆并对第一个圆使用不透明度,但效果不佳。我希望它看起来像这样: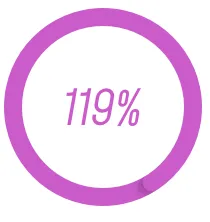 。
。
。<svg viewBox="0 0 36 36" class="circular-chart cons">
<path class="circle-bg" d="M18 2.0845
a 15.9155 15.9155 0 0 1 0 31.831
a 15.9155 15.9155 0 0 1 0 -31.831" />
<path class="circle-round" stroke-dasharray="100 100"
style="opacity: 0.9;" d="M33.9155 18
a 15.9155 15.9155 0 0 1 -31.831 0
a 15.9155 15.9155 0 0 1 31.831 0" />
<path class="circle-round" stroke-dasharray="19 100" d="M33.9155 18
a 15.9155 15.9155 0 0 1 -31.831 0
a 15.9155 15.9155 0 0 1 31.831 0" />
<text x="18" y="20.35" class="percentage cons-fill">119%</text>
</svg>
.circle-bg {
  fill: none;
  stroke: #ddd;
  stroke-width: 3.8;
}
.circle-round{
  fill: none;
  stroke-width: 2.8;
  stroke-linecap: round;
  animation: progress 1s ease-out forwards;
}
.circular-chart.cons .circle-round {
  stroke: $cons;
}
@keyframes progress {
  0% {
    stroke-dasharray: 0 100;
  }
}
.cons-fill {
  fill: $cons;
}