我想在我的柱状图中选择一个柱子,当我选中柱子时,它会改变颜色(这一点我知道如何做),但也要更改相应的x轴标签的颜色。是否有办法做到这一点,如果有,可以请有经验的人帮助我吗?
MPAndroidChart:我能为X轴标签设置不同的颜色吗?
8
- rohan
2
请参考这些问题:#139 和 #387。此外,还可以查看这些问题:https://dev59.com/RV4b5IYBdhLWcg3w1UvL 和 https://dev59.com/dF0a5IYBdhLWcg3w07vt。我希望它们的组合能够帮助您解决问题(我不知道是否真的可能,但也许您可以通过这些数据进行一些变通)。 - Francisco Romero
@Error404,这些链接都没有帮助到所提出的问题。 - Mark O'Sullivan
1个回答
15
可以为x轴标签设置不同的颜色。您需要使用自定义渲染器,类似以下内容:
import android.graphics.Canvas;

import com.github.mikephil.charting.components.XAxis;
import com.github.mikephil.charting.renderer.XAxisRenderer;
import com.github.mikephil.charting.utils.MPPointF;
import com.github.mikephil.charting.utils.Transformer;
import com.github.mikephil.charting.utils.Utils;
import com.github.mikephil.charting.utils.ViewPortHandler;

import java.util.Collections;
import java.util.List;

/**
 * Created by rawsond on 29/01/17.
 */

public class ColoredLabelXAxisRenderer extends XAxisRenderer {

    List<Integer> labelColors;

    public ColoredLabelXAxisRenderer(ViewPortHandler viewPortHandler, XAxis xAxis, Transformer trans) {
        super(viewPortHandler, xAxis, trans);
        labelColors = Collections.EMPTY_LIST;
    }

    public ColoredLabelXAxisRenderer(ViewPortHandler viewPortHandler, XAxis xAxis, Transformer trans, List<Integer> colors) {
        super(viewPortHandler, xAxis, trans);
        this.labelColors = colors;
    }

    @Override
    protected void drawLabels(Canvas c, float pos, MPPointF anchor) {
        final float labelRotationAngleDegrees = mXAxis.getLabelRotationAngle();
        boolean centeringEnabled = mXAxis.isCenterAxisLabelsEnabled();

        float[] positions = new float[mXAxis.mEntryCount * 2];

        for (int i = 0; i < positions.length; i += 2) {

            // only fill x values
            if (centeringEnabled) {
                positions[i] = mXAxis.mCenteredEntries[i / 2];
            } else {
                positions[i] = mXAxis.mEntries[i / 2];
            }
        }

        mTrans.pointValuesToPixel(positions);

        for (int i = 0; i < positions.length; i += 2) {

            float x = positions[i];

            if (mViewPortHandler.isInBoundsX(x)) {

                String label = mXAxis.getValueFormatter().getFormattedValue(mXAxis.mEntries[i / 2], mXAxis);
                int color = getColorForXValue(mXAxis.mEntries[i / 2]); //added

                mAxisLabelPaint.setColor(color);

                if (mXAxis.isAvoidFirstLastClippingEnabled()) {

                    // avoid clipping of the last
                    if (i == mXAxis.mEntryCount - 1 && mXAxis.mEntryCount > 1) {
                        float width = Utils.calcTextWidth(mAxisLabelPaint, label);

                        if (width > mViewPortHandler.offsetRight() * 2
                                && x + width > mViewPortHandler.getChartWidth())
                            x -= width / 2;

                        // avoid clipping of the first
                    } else if (i == 0) {

                        float width = Utils.calcTextWidth(mAxisLabelPaint, label);
                        x += width / 2;
                    }
                }

                drawLabel(c, label, x, pos, anchor, labelRotationAngleDegrees);
            }
        }
    }

    private int getColorForXValue(int index) {
        if (index >= labelColors.size()) return mXAxis.getTextColor();

        if (index < 0) return mXAxis.getTextColor();

        return labelColors.get(index);
    }
}
这样使用:
mChart.setXAxisRenderer(new ColoredLabelXAxisRenderer(mChart.getViewPortHandler(), mChart.getXAxis(), mChart.getTransformer(AxisDependency.LEFT), colors));
其中colors是一个已解析颜色(而非资源ID)的List<Integer>,大小与IDataSet中的条目数相同。由于您已经知道如何在高亮时更改条形的颜色,因此这部分由您完成。只需像通常一样操作colors即可。以下是示例输出:
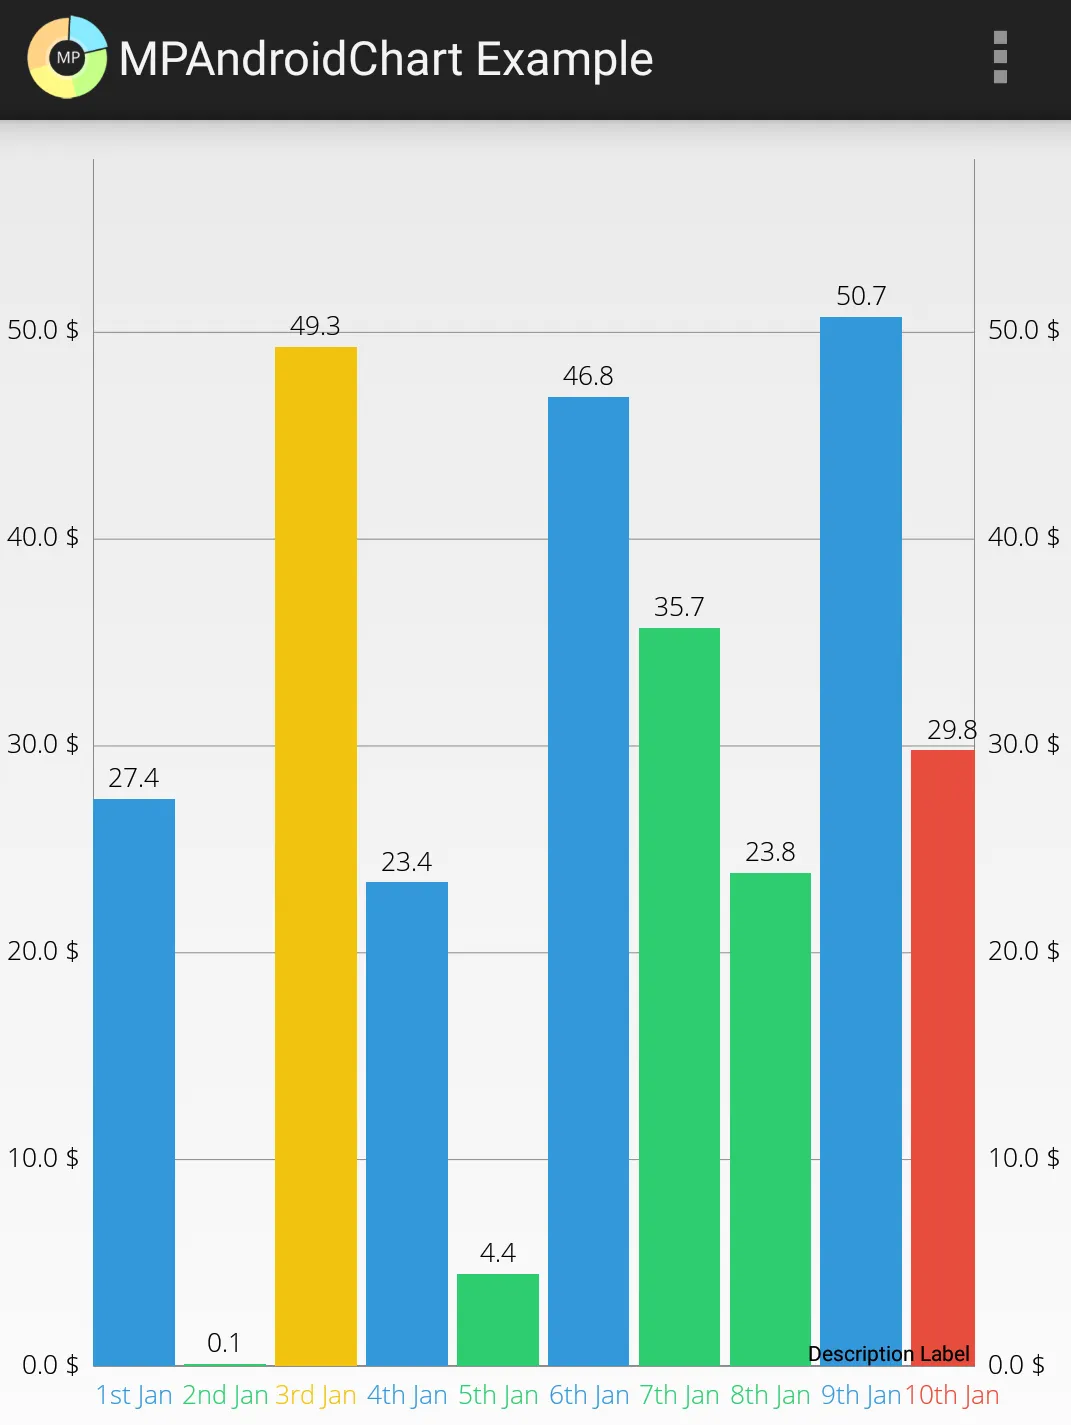
- David Rawson
4
非常有帮助!很抱歉验证它花了这么长时间。 - rohan
嗨,我正在尝试使用这段代码,但是缺少了MPPointF等内容...我该如何获取这段代码? - Sunisha Guptan
@SunishaSindhu,你使用的是哪个版本的MPAndroidChart?此处的答案适用于MPAndroidChart 3.0.1及以上版本。 - David Rawson
{btsdaf} - david
网页内容由stack overflow 提供, 点击上面的可以查看英文原文,
原文链接
原文链接