在ggplot()中,在柱形图的中心放置误差线的问题

7

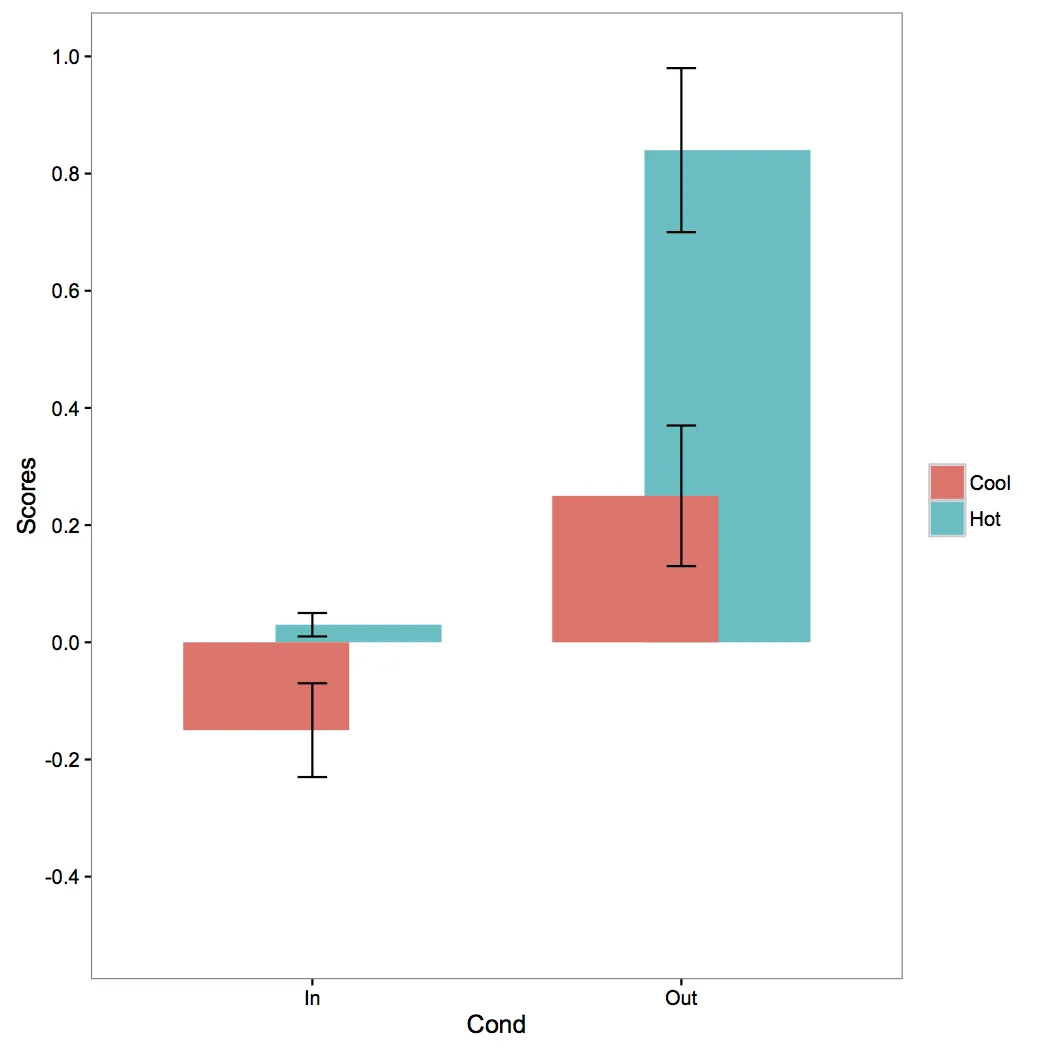
我在制作柱状图时遇到了问题,误差线只出现在分组变量的列角落,而不是居中显示。我使用的代码如下:

a <- data.frame (Cond = c("In", "In", "Out", "Out"),
                Temp = c("Hot", "Cool", "Hot", "Cool"),
                Score = c(.03, -.15, 0.84, 0.25),
                SE = c(.02, .08, .14, .12))
a.bar <- ggplot (data = a, aes(x = Cond, y = Score, fill = Temp)) +
            theme_bw() + theme(panel.grid = element_blank ()) +
            coord_cartesian (ylim = c(-0.5, 1)) + 
            geom_bar (aes(fill = Temp), stat = "identity", position = "dodge", width = .5) +
            geom_errorbar (aes(ymin = Score - SE, ymax = Score + SE, group = Cond), position = position_dodge(.9), width = .08) +
            labs(y = "Scores" , x = "Cond") +
            scale_y_continuous (breaks = pretty_breaks(n=8)) +
            theme(legend.title = element_blank()) +
            theme(legend.position = "right")

我尝试了其他的代码,但都无法正常工作。其中包括在 geom_bar() 中添加 "show.legend = FALSE";在 plot.a 中添加 "facet_wrap(~Cond)";以及在 ggplot(aes()) 中添加 "fill = Temp"。

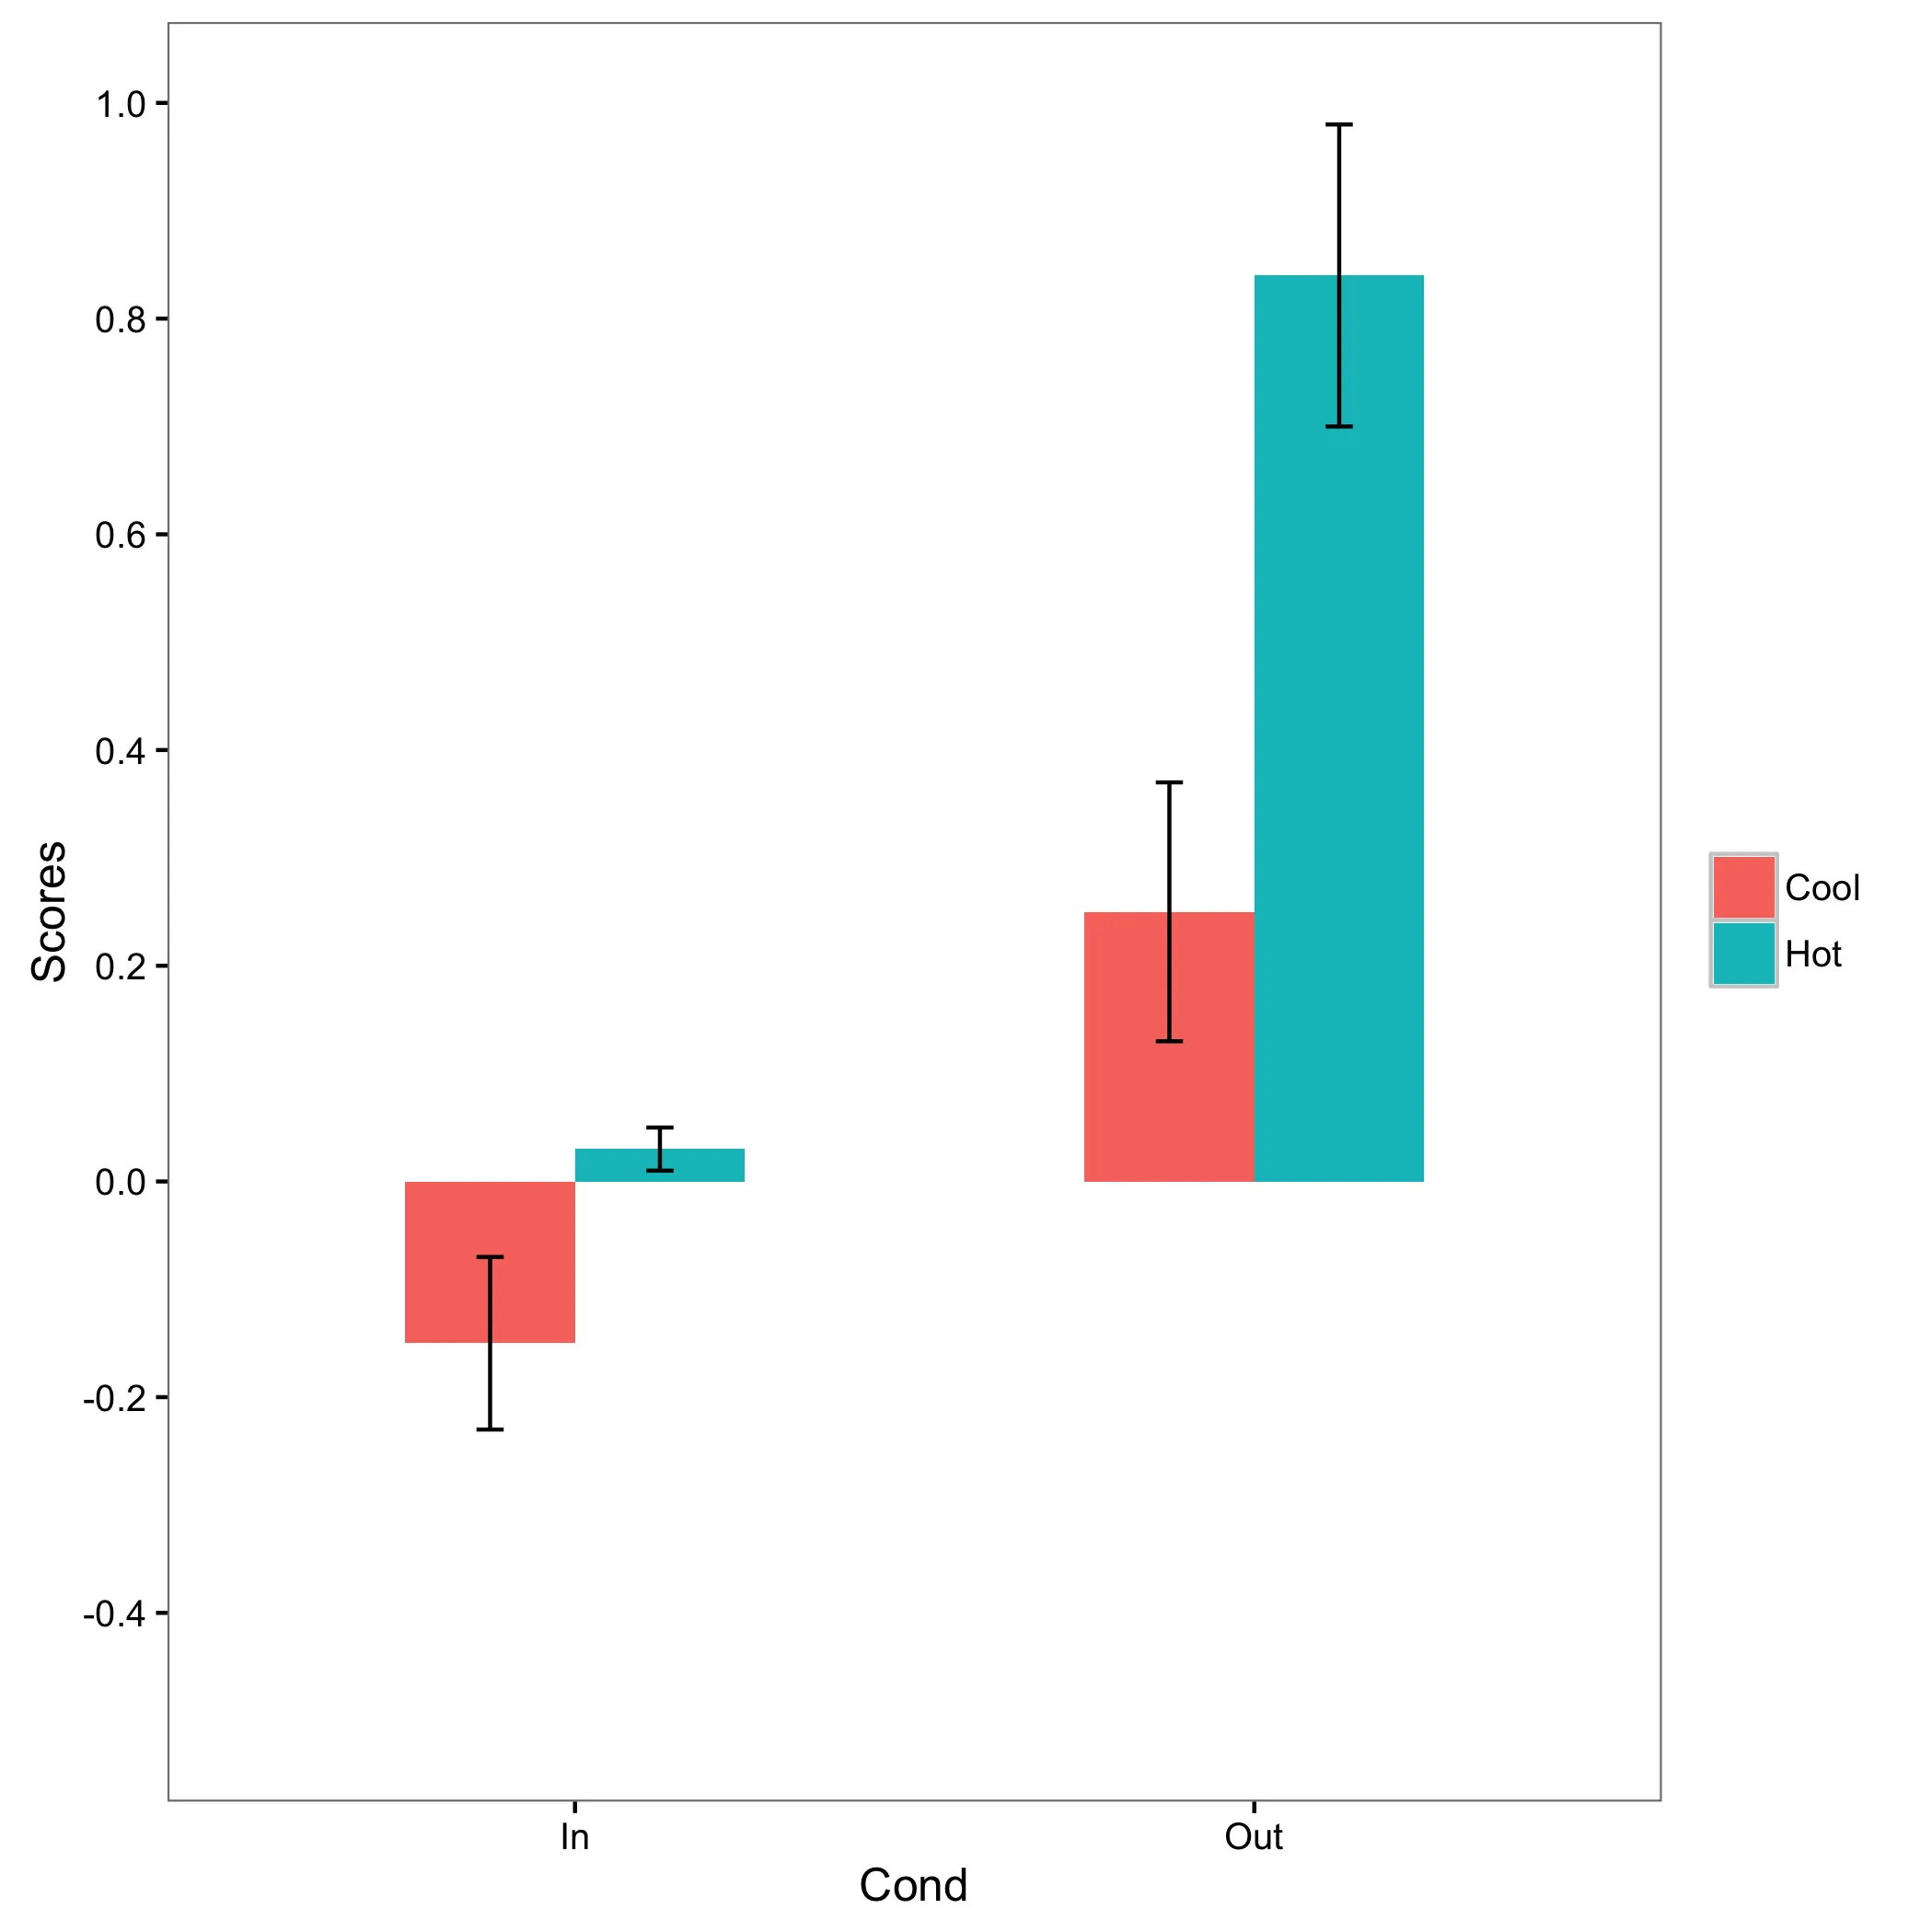
最接近的解决方案是将 position_dodge() 参数改为:

geom_bar (aes(fill = Temp), stat = "identity", position = position_dodge(width = .5)) +
geom_errorbar (aes(ymin = Score - SE, ymax = Score + SE, group = Cond), position = position_dodge(.5), width = .08) +

(其余代码保持不变)。这将误差棒移向列的中心,但也使列相互靠近,最终导致它们重叠在一起(请参见附图)。

请参见附图

我非常感谢您能提供帮助。

谢谢!

2个回答

15

好问题。以下是一些评论:

  1. 通常最好的做法是在原始的 ggplot() 中设置所有的美学元素,并且只有在单独的 geom_xyz() 调用中需要覆盖它们。在你的代码中,你在 ggplotgeom_bar 中都设置了填充美学元素。你还在 geom_errorbar() 中设置了组的美学元素。我不认为这些是最终的问题所在,但它们确实使调试代码更加困难。

  2. 主要问题在于 geom_bar 中的 width 参数必须与 geom_errorbar 中的 position_dodge() 参数匹配。因此,如果你有

    # ...
    geom_bar(stat = "identity", position = "dodge", width = 0.5)
    # ...
    

    那么你需要确保你的geom_errorbar()看起来像

    # ...
    geom_errorbar(width = .08, position = position_dodge(0.5)) 
    # ...
    

把所有东西放在一起:

require(ggplot2)
require(scales)

# define data
a <- data.frame (Cond = c("In", "In", "Out", "Out"),
                Temp = c("Hot", "Cool", "Hot", "Cool"),
                Score = c(.03, -.15, 0.84, 0.25),
                SE = c(.02, .08, .14, .12))

# return plot with everything except error bars
a.bar <- ggplot (data = a, aes(x = Cond, 
                               y = Score, 
                               fill = Temp,
                               ymin = Score - SE,
                               ymax = Score + SE)) +
            theme_bw() + 
            theme(panel.grid = element_blank ()) +
            coord_cartesian(ylim = c(-0.5, 1)) + 
            # manually setting the width means we will have to tell geom_errorbar() about the new width
            geom_bar(stat = "identity", position = "dodge", width = 0.5) + 
            labs(y = "Scores", x = "Cond") +
            scale_y_continuous(breaks = pretty_breaks(n = 8)) +
            theme(legend.title = element_blank()) +
            theme(legend.position = "right")

# show plot w/ errorbars, note that argument to position_dodge is same as width supplied above
a.bar + geom_errorbar(width = .08, position = position_dodge(0.5)) 

# save results
ggsave('SO_35424162.png')

最终图形


1

我想补充一下,因为我也遇到了同样的问题:

非常重要的是要在主要的aes()中指定fill参数,而不是在geom_barplot中指定。


这非常重要!我很长时间无法调试它(因为我认为fill应该是无关紧要的),但这是至关重要的,而且不是特别直观的。 - Devon

网页内容由stack overflow 提供, 点击上面的
可以查看英文原文,
原文链接