ggplot抖动图和误差线geom_errorbar?

14

我的数据看起来像这样:

df1 <-
  structure(
    list(
      y = c(-0.19, 0.3,-0.05, 0.15,-0.05, 0.15),
      lb = c(-0.61,
             0.1,-0.19,-0.06,-0.19,-0.06),
      ub = c(0.22, 0.51, 0.09, 0.36,
             0.09, 0.36),
      x = structure(
        c(1L, 2L, 1L, 2L, 1L, 2L),
        .Label = c("X1",
                   "X2"),
        class = "factor"
      ),
      Group = c("A", "A", "B", "B", "C",
                "C")
    ),
    .Names = c("y", "lb", "ub", "x", "Group"),
    row.names = c(NA,-6L),
    class = "data.frame"
  )

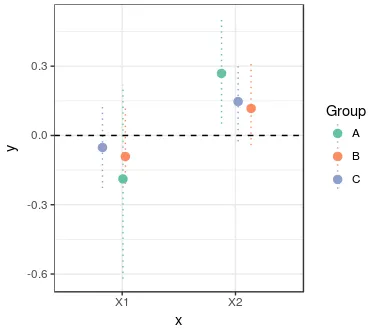
我想使用ggplot2绘制点x,y,用group着色并带有误差线lb, ub。由于x是离散的,所以我想要jitter使点和柱不重叠。目前,我可以jitter点,但无法处理线条。此外,我希望点的顺序为A、B、C。

ggplot(data = df1, aes(x, y, color = Group)) + geom_point(size = 4, position = "jitter") +
  geom_errorbar(
    aes(ymin = lb, ymax = ub),
    width = 0.1,
    linetype = "dotted"
  ) +
  geom_hline(aes(yintercept = 0), linetype = "dashed") + theme_bw()

在此输入图像描述

2个回答

21
你可以使用position_dodge来实现所需的顺序,并在点的位置绘制误差线。
ggplot(data = df1, aes(x, y, color = Group)) +
    geom_point(size = 4, position=position_dodge(width=0.5)) +
    geom_errorbar(
        aes(ymin = lb, ymax = ub),
        width = 0.1,
        linetype = "dotted",
        position=position_dodge(width=0.5)) +
    geom_hline(aes(yintercept = 0), linetype = "dashed") + 
    theme_bw()

在此输入图片描述


这是一个很好的答案,但如果每个x轴类别中有多个点怎么办?
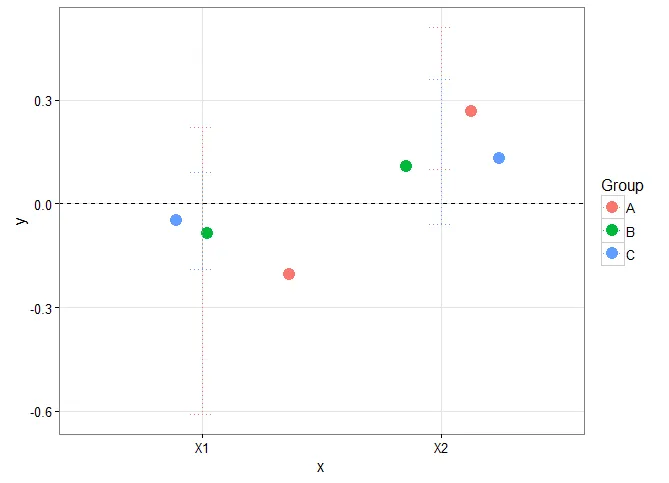
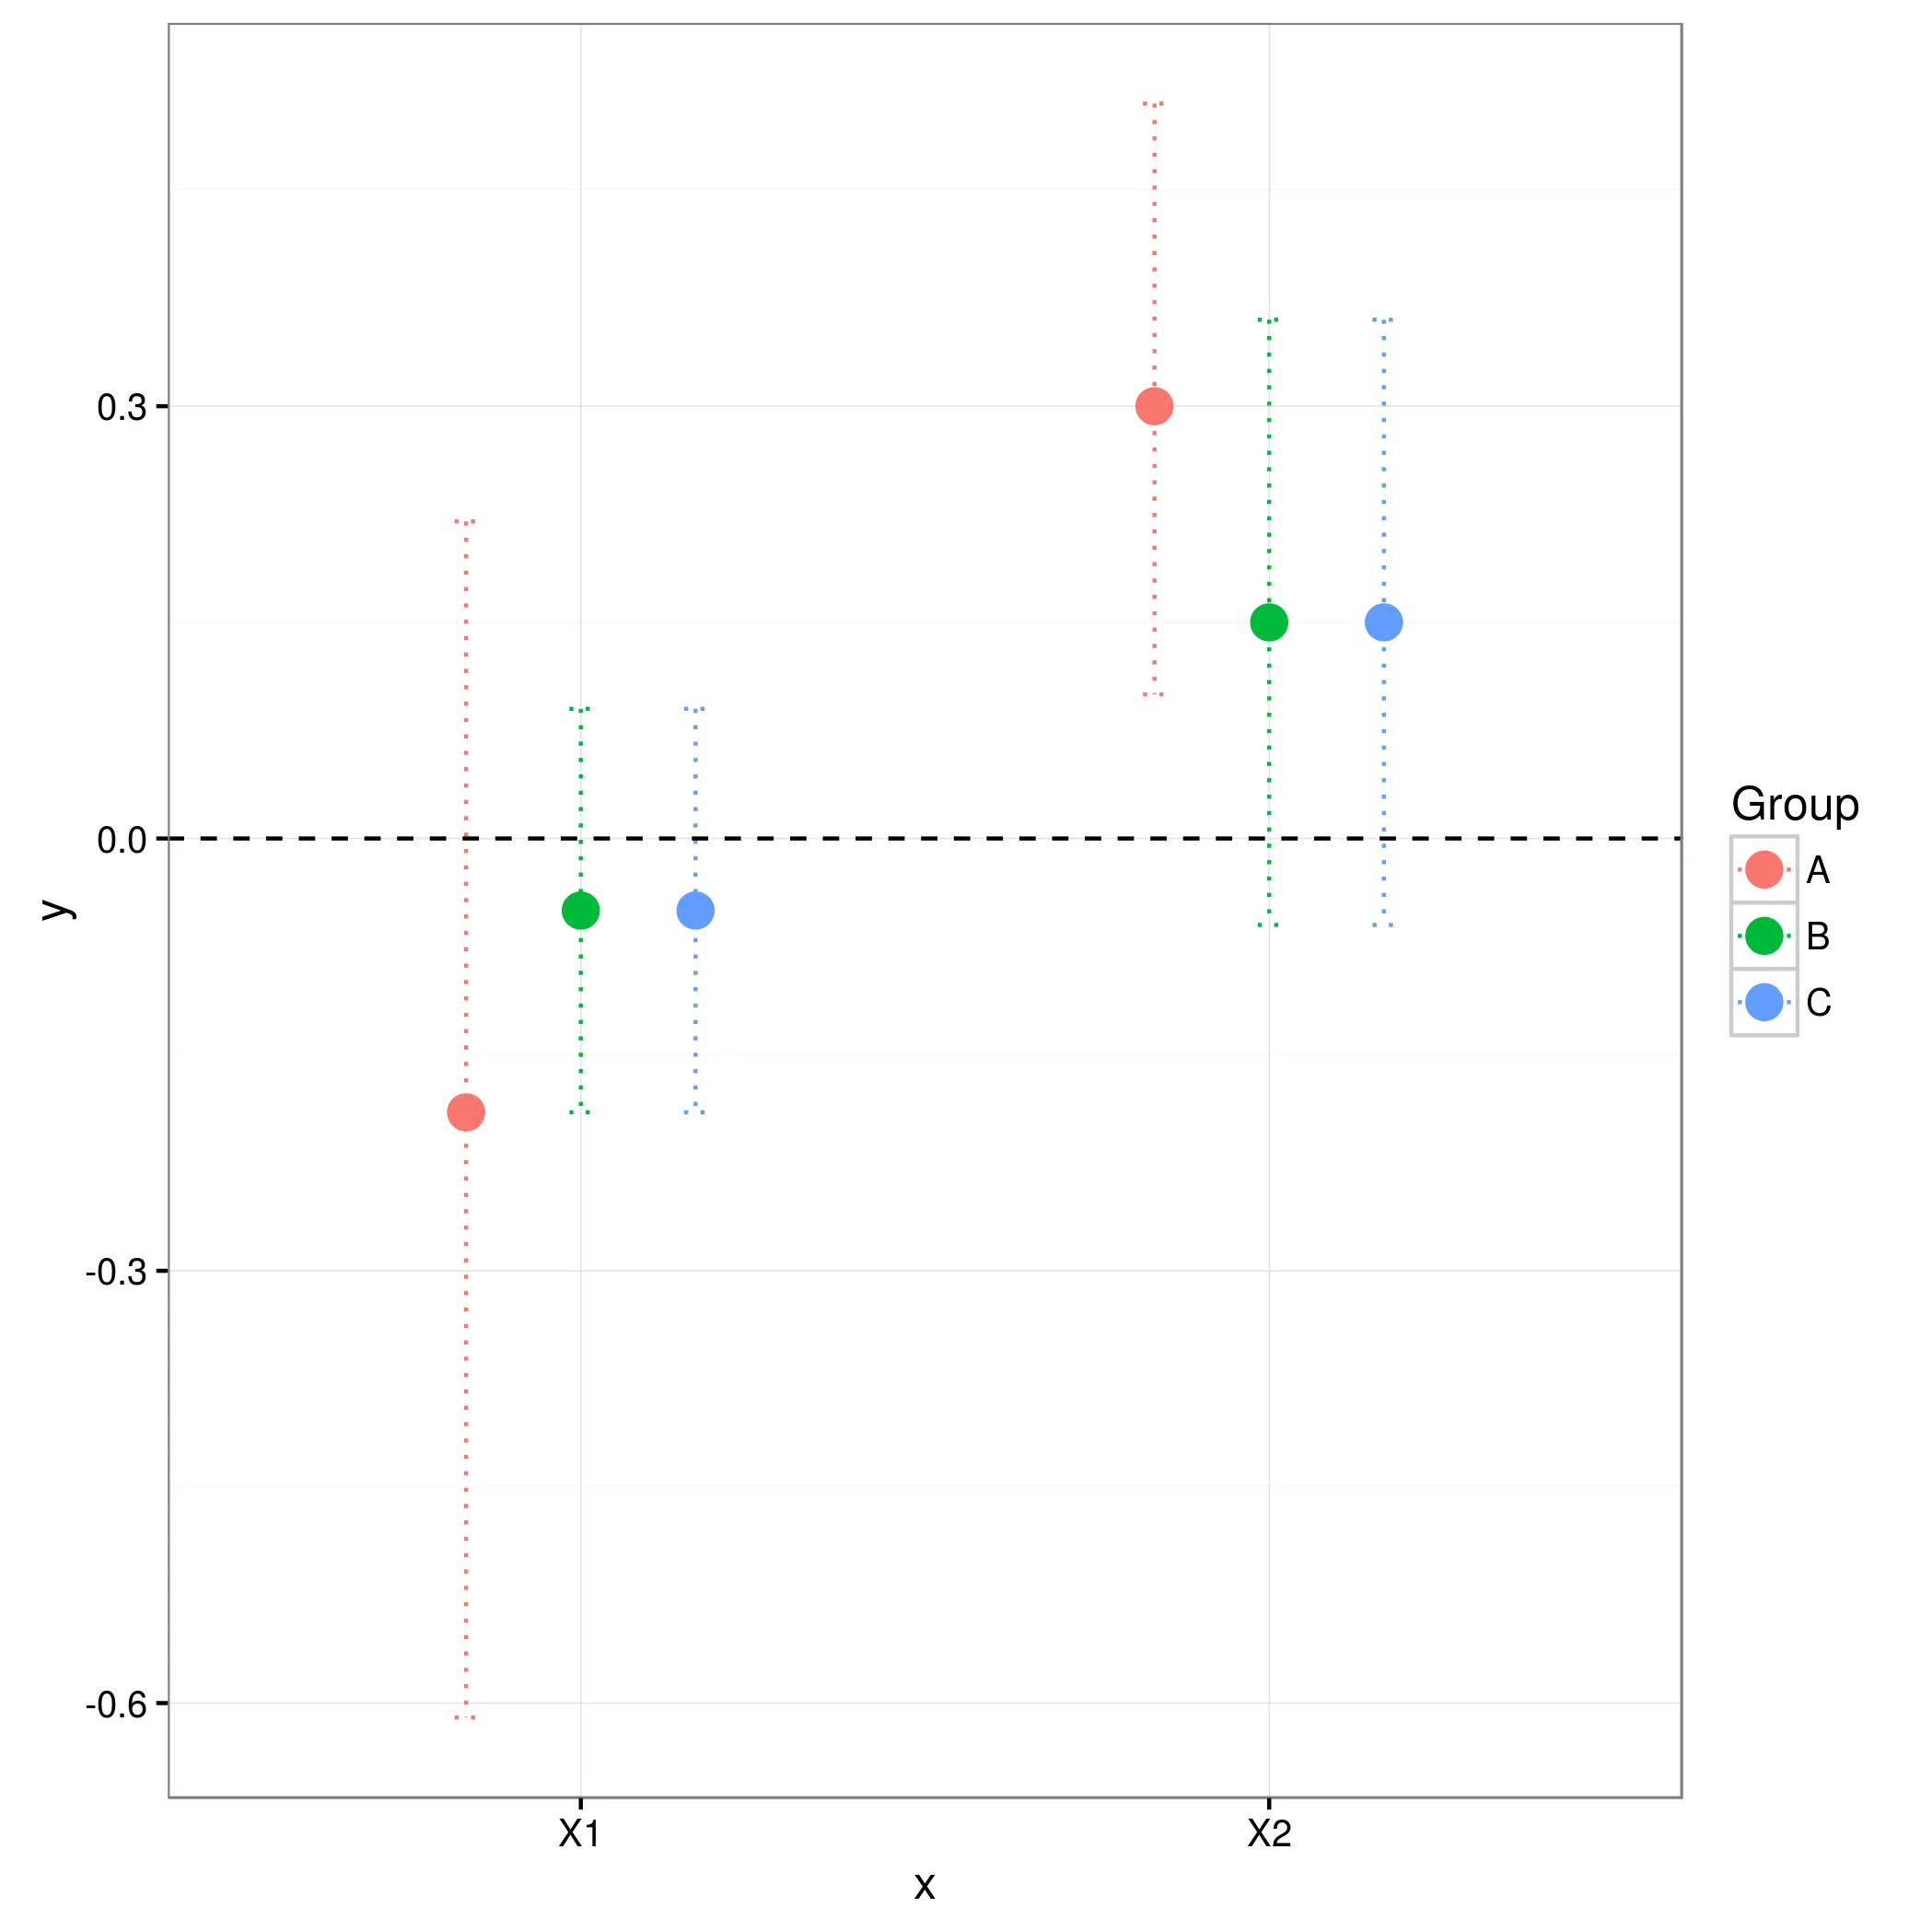
position_width将所有点放在垂直线上,因此误差条在类别内重叠。有没有一种方法可以在类别内实现更进一步的抖动,并仍然使误差条与点对齐? - EcologyTom
@EcologyTom,你可以定义一个新的因子,考虑每个类别中的点数?例如,如果类别A中有2个点,则您的因子级别将是A1、A2、B、C..我不认为有一种方法可以结合dodge和jitter来描述您所描述的方式。 - konvas
那似乎是一个不错的解决方法。我最终找到了这个答案,它提供了一种解决方案。但是你的建议会更直接,特别是如果点数不太多的话。谢谢! - EcologyTom

6
如果您想要抖动,可以这样做:
ggplot(data = df1, aes(x, y, color = Group)) +
    geom_pointrange(aes(ymin = lb, ymax = ub), 
                    position=position_jitter(width=0.5), 
                    linetype='dotted') +
    theme_bw()

enter image description here


网页内容由stack overflow 提供, 点击上面的
可以查看英文原文,
原文链接