我正在尝试制作一张“偏爱”较低值的颜色地图,即从深色到浅色需要更长的时间。目前我正在使用以下颜色地图:
cmap = clr.LinearSegmentedColormap.from_list('custom blue', ['#ffff00','#002266'], N=256)
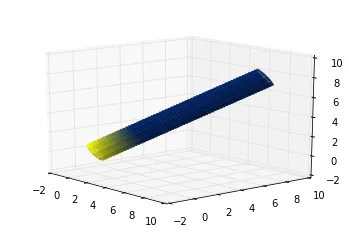
我正在将这个绘图应用在一个圆柱体上,以查看效果(请参见帖子末尾的圆柱体代码),运行代码后会出现以下情况:

你可以看到这是非常“线性”的。颜色在圆柱体的一半左右开始变化。有没有办法增加阈值,使颜色开始迅速变化的时候更高?也就是说,我只想让非常高的数字具有最亮的黄色级别。谢谢。
from matplotlib import cm
from matplotlib import pyplot as plt
from mpl_toolkits.mplot3d import Axes3D
from scipy.linalg import norm
from mpl_toolkits.mplot3d.art3d import Poly3DCollection
import numpy as np
import math
import mpl_toolkits.mplot3d.art3d as art3d
import matplotlib.colors as clr


fig = plt.figure()
ax = fig.add_subplot(111, projection='3d')


origin = [0,0,0]
#radius = R
p0 = np.array(origin)
p1 = np.array([8, 8, 8])
origin = np.array(origin)
R = 1

#vector in direction of axis
v = p1 - p0
#find magnitude of vector
mag = norm(v)
#unit vector in direction of axis
v = v / mag
#make some vector not in the same direction as v
not_v = np.array([1, 0, 0])
if (v == not_v).all():
not_v = np.array([0, 1, 0])
#make vector perpendicular to v
n1 = np.cross(v, not_v)
#normalize n1
n1 /= norm(n1)
#make unit vector perpendicular to v and n1
n2 = np.cross(v, n1)
#surface ranges over t from 0 to length of axis and 0 to 2*pi
t = np.linspace(0, mag, 600)
theta = np.linspace(0, 2 * np.pi, 100)
#use meshgrid to make 2d arrays
t, theta = np.meshgrid(t, theta)
#generate coordinates for surface
X, Y, Z = [p0[i] + v[i] * t + R * np.sin(theta) * n1[i] + R * np.cos(theta) *     n2[i] for i in [0, 1, 2]]

#THIS IS WHERE THE COLOR MAP IS

cmap = clr.LinearSegmentedColormap.from_list('custom blue',     ['#ffff00','#002266'], N=256)
col1 = cmap(np.linspace(0,1,600)) # linear gradient along the t-axis
col1 = np.repeat(col1[np.newaxis,:, :], 100, axis=0) # expand over the theta-            axis

ax.plot_surface(X, Y,Z, facecolors = col1, shade = True,edgecolors = "None",        alpha = 0.9, linewidth = 0)
ax.view_init(15,-40)

plt.show()