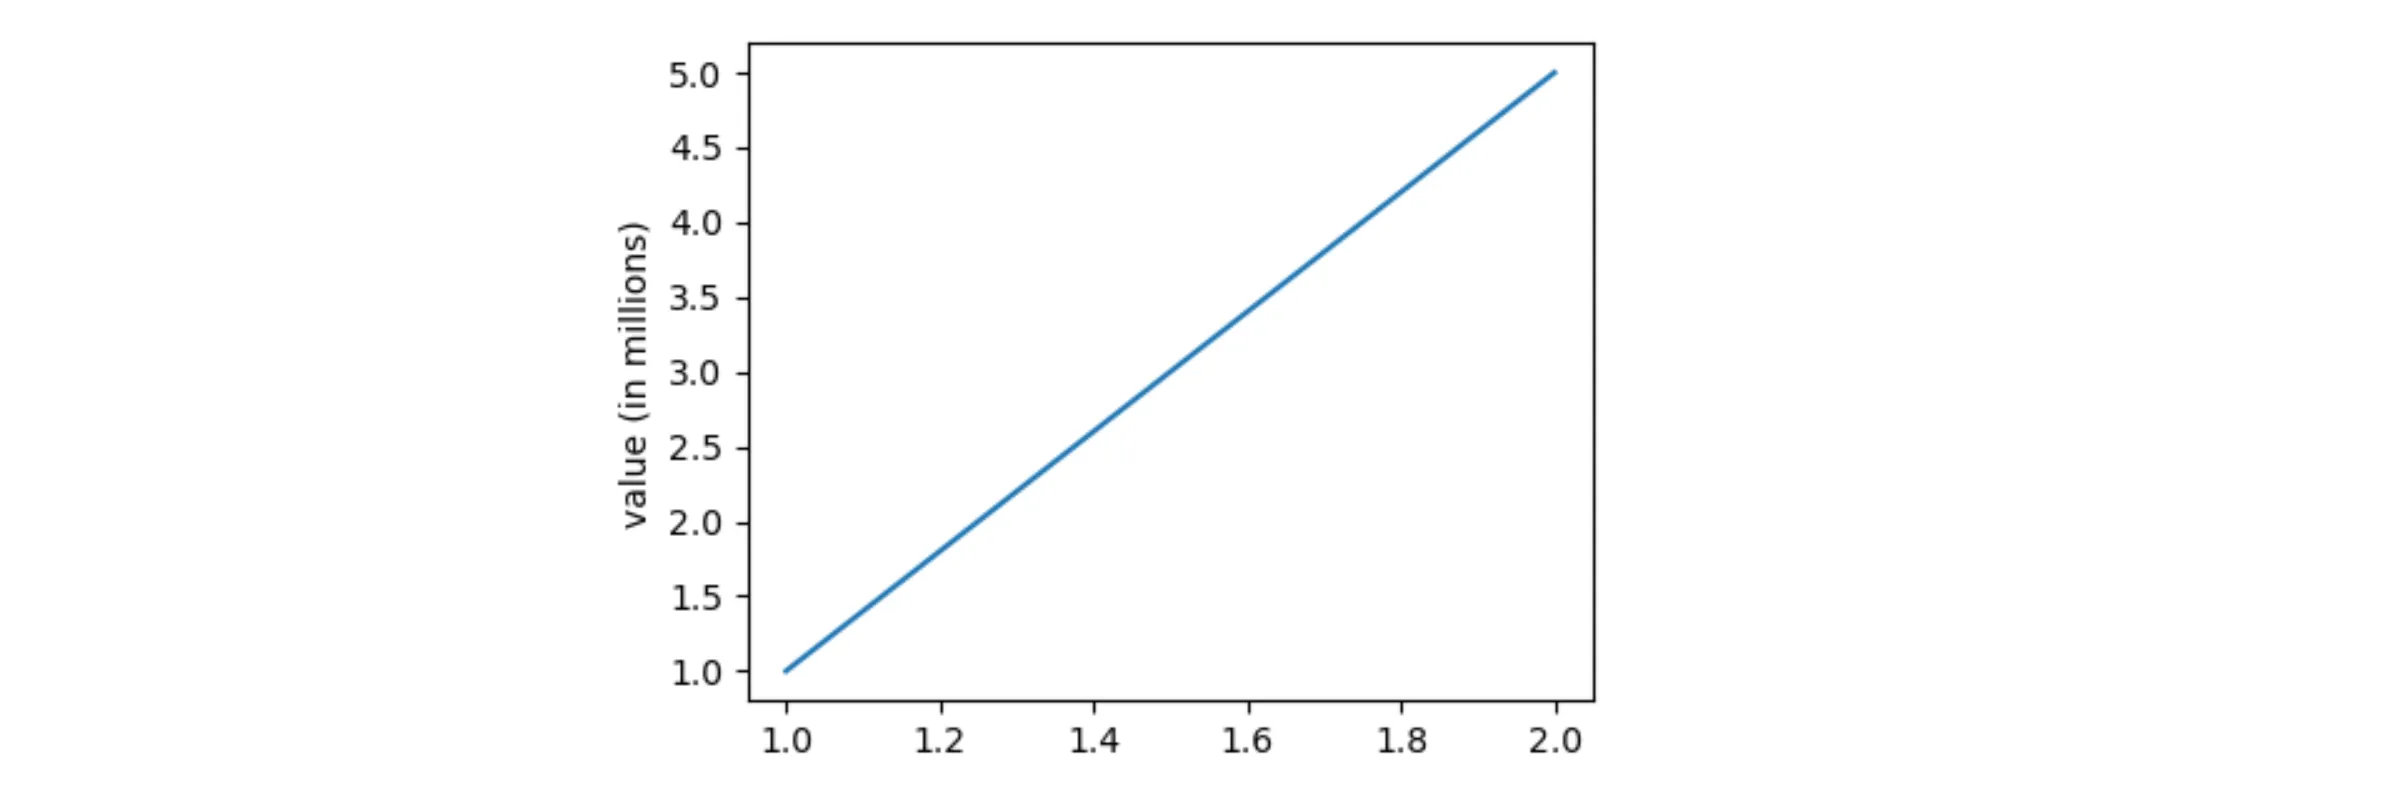
我对这个图表有问题:
[![在此输入图片描述][1]][1]
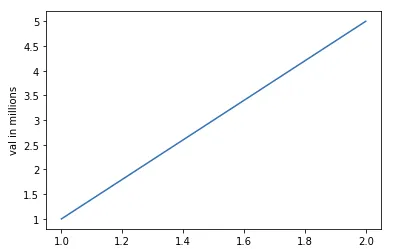
纵轴单位是单位,但我需要将它们转换为百万,就像这样:
[![在此输入图片描述][2]][2]
你知道如何实现这一点吗?先行致谢。
我对这个图表有问题:
[![在此输入图片描述][1]][1]
纵轴单位是单位,但我需要将它们转换为百万,就像这样:
[![在此输入图片描述][2]][2]
你知道如何实现这一点吗?先行致谢。
from matplotlib.ticker import FuncFormatter
import matplotlib.pyplot as plt
def millions(x, pos):
    'The two args are the value and tick position'
    return '%1.1fM' % (x * 1e-6)


formatter = FuncFormatter(millions)

fig, ax = plt.subplots()
ax.yaxis.set_major_formatter(formatter)
或者你甚至可以使用以下函数将“millions”替换为支持所有数量级:
def human_format(num, pos):
    magnitude = 0
    while abs(num) >= 1000:
        magnitude += 1
        num /= 1000.0
    # add more suffixes if you need them
    return '%.2f%s' % (num, ['', 'K', 'M', 'G', 'T', 'P'][magnitude])
import pandas as pd
import matplotlib .pyplot as plt
import matplotlib.ticker as ticker
fig, ax=plt.subplots()
ax.plot([1, 2], [1000000, 5000000])
scale_y = 1e6
ticks_y = ticker.FuncFormatter(lambda x, pos: '{0:g}'.format(x/scale_y))
ax.yaxis.set_major_formatter(ticks_y)
ax.set_ylabel('val in millions')
FuncFormatter:from matplotlib import pyplot as plt
from matplotlib.ticker import FuncFormatter
def millions_formatter(x, pos):
return f'{x / 1000000}'
fig, ax = plt.subplots()
ax.plot([1, 2], [1000000, 5000000])
ax.yaxis.set_major_formatter(FuncFormatter(millions_formatter))
ax.set_ylabel('value (in millions)')
plt.show()