有没有办法在散点图上更改坐标轴?比如将坐标轴从(0,0)即(零线)移动到类似于(3,3)并制作象限图。
我尝试在“xaxis”和“yaxis”上设置“zeroline”值为False,然后从“shapes”绘制两条常数线穿过两个坐标轴。但我想知道是否有任何方法可以更改原点坐标轴。
import plotly.graph_objs as go
import plotly
import plotly.io as pio
trace0 = go.Scatter(
x=[7],
y=[7.5],
)
data = [trace0]
layout = {
'xaxis': {
'zeroline': False,
'dtick': 1,
},
'yaxis': {
'zeroline': False,
'dtick': 1,
},
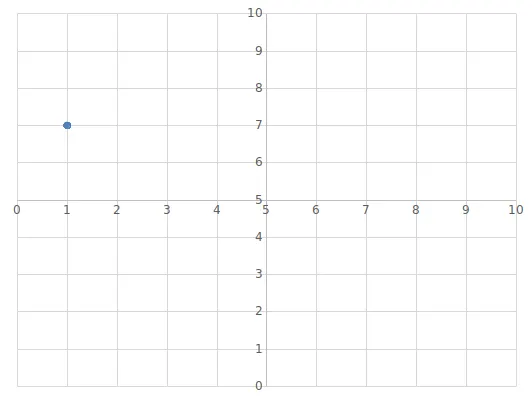
'shapes': [
{
'type': 'line',
'x0': 5,
'y0': 0,
'x1': 5,
'y1': 10,
'line': {
'width': 1,
},
},
{
'type': 'line',
'x0': 0,
'y0': 5,
'x1': 10,
'y1': 5,
'line': {
'width': 1
},
},
]
}
fig = {
'data': data,
'layout': layout,
}
plotly.offline.plot(fig)
pio.write_image(fig, 'images/test.png')