ggplot2中的Stat_smooth不显示

4

我正在尝试向我的ggplot中添加一条lm线,代码如下:

# RING data:
#### Read data & Converting factors ####
dat <- read.table("RING R kopi.txt", header=TRUE)  
str(dat)
dat$Vial <- as.factor(dat$Vial)
dat$Line <- as.factor(dat$Line)
dat$rep <- as.factor(dat$rep)
dat$fly <- as.factor(dat$fly)  
str(dat)

datSUM <- summaryBy(t05+t10+t15+t20+t25+t30~rep+Conc+Sex+Line+Vial,data=dat, FUN=sum)
fl<-levels(datSUM$Line)
datA <- droplevels(datSUM[datSUM$Conc=="a",])
datB <- droplevels(datSUM[datSUM$Conc=="b",])
datC <- droplevels(datSUM[datSUM$Conc=="c",]) 
datD <- droplevels(datSUM[datSUM$Conc=="d",])
datE <- droplevels(datSUM[datSUM$Conc=="e",])
datX <- droplevels(datSUM[datSUM$Conc=="x",])
datY <- droplevels(datSUM[datSUM$Conc=="y",])


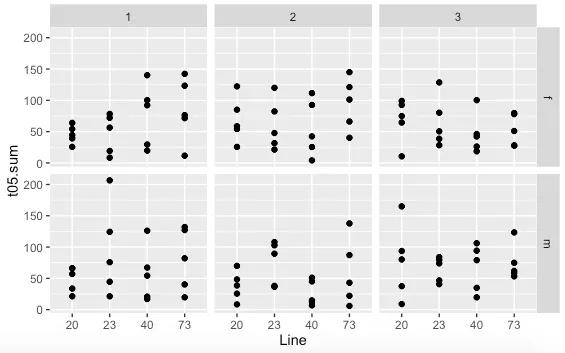
c <- ggplot(Line, t05.sum, data= datA, facets=Sex~rep)
c + stat_smooth(method=lm, fullrange = TRUE) + geom_point()

脚本运行了但没有添加任何行,我还尝试使用:
c + stat_smooth(method=lm) + geom_point()
c + stat_smooth(method=lm, fullrange=TRUE, alpha = 0.05) + geom_point()
c <- qplot(aes(y=Line, x=t05.sum), data= datA, facets=Sex~rep)
c + stat_smooth(method=lm, fullrange = TRUE) + geom_point()

结果: 在此输入图片描述 数据集的子集:
请注意,这是一个R代码段,其中包含一个数据框。该数据框具有6列和25行,并且每列都是因子变量。每一行代表一个实验测量值。以下是每个列的详细信息:
- rep:重复次数(1、2或3) - Conc:化合物的浓度(a) - Sex:参与实验的性别(f表示女性,m表示男性) - Line:参与实验的动物品系编号(20、23、40或73) - Vial:存储样本的瓶子编号 - t05.sum、t10.sum、t15.sum、t20.sum、t25.sum和t30.sum:测量结果
请注意,这些结果是在不同时间点(5、10、15、20、25和30分钟)测量的。

1
你能否通过展示“dat”的内容使你的问题可重现? - mtoto
请勿包含图片,使用 dput() - mtoto
这是你想要的吗? - Mikkel Astrup
我已经使用dput()从R Studio复制了精确的输出。 - Mikkel Astrup
尝试创建一个玩具数据框,它太长了。 - PavoDive
请尝试使用ggplot()而不是qplot()。 - Vikram Venkat
2个回答

6

我正在使用您发布的dput输出作为我的数据。

检查数据,我们可以看到Line是一个因子:

'data.frame':   25 obs. of  11 variables:
 $ rep    : Factor w/ 3 levels "1","2","3": 1 1 1 1 1 1 1 1 1 1 ...
 $ Conc   : Factor w/ 1 level "a": 1 1 1 1 1 1 1 1 1 1 ...
 $ Sex    : Factor w/ 2 levels "f","m": 1 1 1 1 1 1 1 1 1 1 ...
 $ Line   : Factor w/ 4 levels "20","23","40",..: 1 1 1 1 1 2 2 2 2 2 ...
 [TRUNCATED]

因此,当您尝试使用“stat_smooth”时,它不知道在拟合平滑器时如何处理Line的级别。

在绘制之前,您需要将Line转换为数字。

您可以通过更改数据框来实现这一点:

datA$Line <- as.numeric(as.character(Line)) # need to convert before to char
# or the numeric values will become the internal factor numbers and not the labels

然后你按照之前的方法绘图:
c <- qplot(Line, t05.sum, data= datA, facets=Sex~rep)
c + stat_smooth(method=lm, fullrange = TRUE) + geom_point()

您也可以在qplot调用中进行转换,如下所示:

c <- qplot(as.numeric(as.character(Line)), t05.sum, 
        data= datA, facets=Sex~rep)

太棒了!谢谢,正是我所需要的! - Mikkel Astrup

0

数据缺失,我刚刚创建了一个玩具数据框。我认为这就是你需要的:

set.seed(1)
df <- data.frame(Line = sample(c(20, 23, 40, 73), 100, TRUE), 
                 t = runif(100, 0, 200), 
                 Sex = sample(c("F", "M"), 100, TRUE), 
                 rep = sample(c("1", "2", "3"), 100, TRUE))

然后绘图:

library(ggplot2)

ggplot(df, aes(x= Line, y = t)) + 
  geom_point() + 
  facet_grid(Sex~rep) + 
  stat_smooth()

如果Line是一个因素,这个方法就不起作用了。这可能是OP问题的根源。 - zelite
是的,行号是一个因素,有没有处理这个问题的方法? - Mikkel Astrup
附带说明:如果该变量的所有可能值都是数字(这是示例的情况),我建议将它们编码为数字,而不是寻找绕过它们的方法来表示它们。 - PavoDive

网页内容由stack overflow 提供, 点击上面的
可以查看英文原文,
原文链接