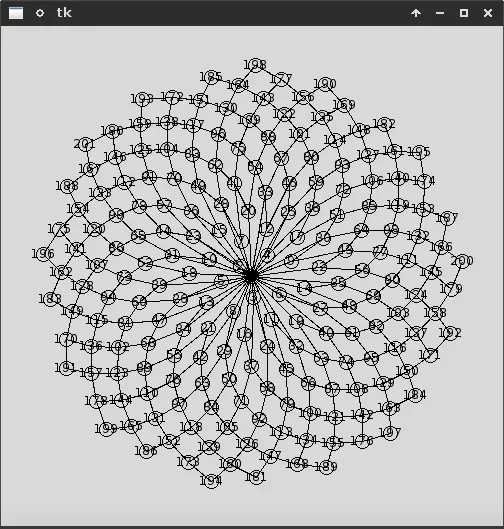
我正在尝试使用tkinter绘制一个斐波那契向日葵。它可以正确绘制出来,但我想要能够绘制出旋转曲线。然而,我无法弄清如何正确地将它们连接起来。有什么想法吗?
以下是我的代码:
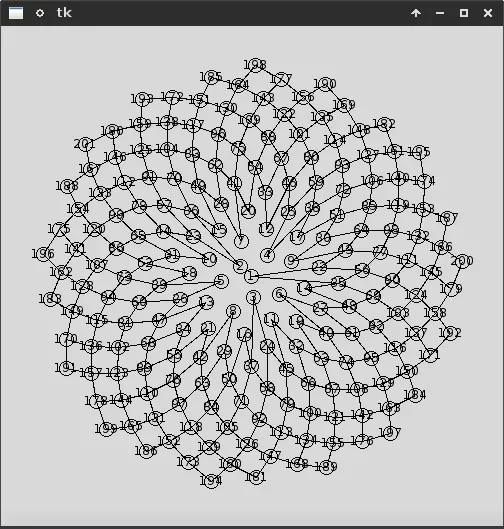
这是我想要实现的结果:
以下是我的代码:
import math
from tkinter import *

def s5(n,r): #works better for first direction
    spirals = []
    for i in range(n+1):
        spirals.append(((r*(i**0.5),((i*(360)/(((5**0.5)+1)/2))%360))))
    return spirals

# convert to cartesian to plot
def pol2cart(r,theta):
    x = r * math.cos(math.radians(theta))
    y = r * math.sin(math.radians(theta))
    return x,y

# set size of fib sun
num_points = 200
distance = 15

# do the cartesian conversion
coordinates = [pol2cart(r,t) for r,t in s5(num_points,distance)]

# center for the canvas
coordinates = [(x+250,y+250) for x,y in coordinates]

# create gui
master = Tk()
canvas = Canvas(master,width = 500,height=500)
canvas.pack()


# plot points
h= 1
for x,y in coordinates:
    canvas.create_oval(x+7,y+7,x-7,y-7)
    canvas.create_text(x,y,text=h)
    h += 1

mainloop()
这是我想要实现的结果:
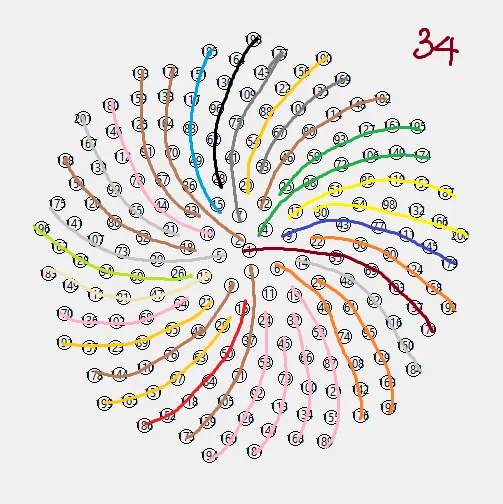
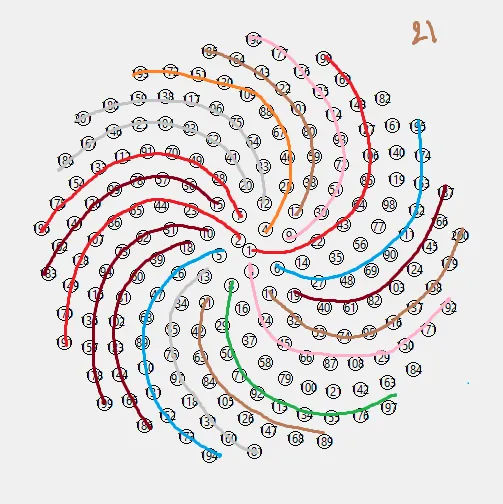 实际上,这些数字并不神奇,它们来自于斐波那契数列,并且基于螺旋的层数,您应该能够检测到它。因此,您总是有像0、1、1、2、3、5、8、13、21、34、55这样的数字差异。