使用mean_cl_boot计算的stat_summary值

3

我正在使用mean_cl_boot绘制一些X值,并带有大置信区间。

如何导出每个组中fun.y = meanfun.data = mean_cl_boot的值的文本?

我有一个mean_cl_boot值的区间,并且希望将它们绘制并导出。

ggplot(iris, aes(x = Species, y = Petal.Length)) + 
geom_jitter(width = 0.5) + stat_summary(fun.y = mean, geom = "point", color = "red") + 
stat_summary(fun.data = mean_cl_boot, fun.args=(conf.int=0.9999), geom = "errorbar", width = 0.4)

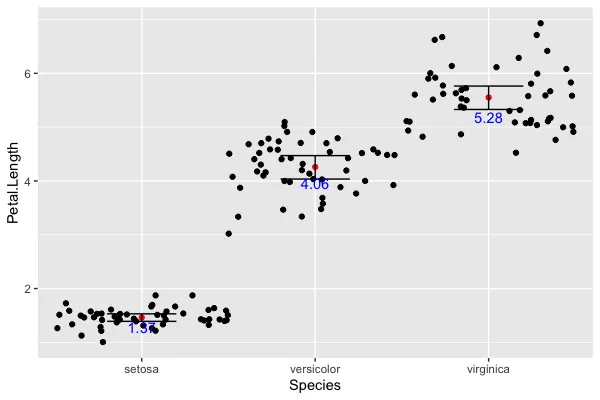
我需要绘制均值(fun.y = mean)值,使用:

stat_summary(fun.y=mean, geom="text", aes(label=sprintf("%1.1f", ..y..)),size=3, show.legend=FALSE

但是我无法像mean_cl_boot一样做到这一点。

1个回答

6
你可以使用 ggplot_build 来获取 stat_summary 的数据。

首先,将你的 ggplot 调用存储在一个对象中:

g <- ggplot(iris, aes(x = Species, y = Petal.Length)) + 
  geom_jitter(width = 0.5) + 
  stat_summary(fun.y = mean, geom = "point", color = "red") + 
  stat_summary(fun.data = mean_cl_boot, fun.args=(conf.int=0.9999), geom = "errorbar", width = 0.4)

然后,使用:
ggplot_build(g)$data[[3]]

您将获得使用mean_cl_boot计算的值:

  x group     y     ymin     ymax PANEL xmin xmax colour size linetype width alpha
1 1     1 1.462 1.386000 1.543501     1  0.8  1.2  black  0.5        1   0.4    NA
2 2     2 4.260 4.024899 4.462202     1  1.8  2.2  black  0.5        1   0.4    NA
3 3     3 5.552 5.337199 5.798202     1  2.8  3.2  black  0.5        1   0.4    NA

为了正确获取标签,您可以执行以下操作:
# extract the data
mcb <- ggplot_build(g)$data[[3]]

# add the labels to the plot
g + geom_text(data = mcb,
              aes(x = group, y = ymin, label = round(ymin,2)),
              color = "blue",
              vjust = 1)

结果:

enter image description here

但更好的选择可能是使用包:

library(ggrepel)

g + geom_label_repel(data = mcb,
                     aes(x = group, y = ymin, label = round(ymin,2)),
                     color = "blue",
                     nudge_x = 0.2,
                     nudge_y = -0.2)

那个的结果:

enter image description here


我观察到通过使用以下代码: stat_summary(fun.data = mean_cl_boot, fun.args=(conf.int=0.9999), geom = "text", aes(label=sprintf("%1.1f", ..ymin..)), width = 0.4) 或 ymax 我可以绘制出ymax和ymin,但是它们在图表上没有明确的位置。你有什么想法吗? - Gabriel G.
@GabrielG。您所说的“定义位置”是什么意思? - Jaap
例如,误差条下方的最小值和上方的最大值。如果我在上面的代码中使用vjust,对齐就不完美! - Gabriel G.
1
图表非常好看,非常感谢! - Gabriel G.

网页内容由stack overflow 提供, 点击上面的
可以查看英文原文,
原文链接